Copyright
©The Author(s) 2018.
World J Gastroenterol. Dec 7, 2018; 24(45): 5179-5188
Published online Dec 7, 2018. doi: 10.3748/wjg.v24.i45.5179
Published online Dec 7, 2018. doi: 10.3748/wjg.v24.i45.5179
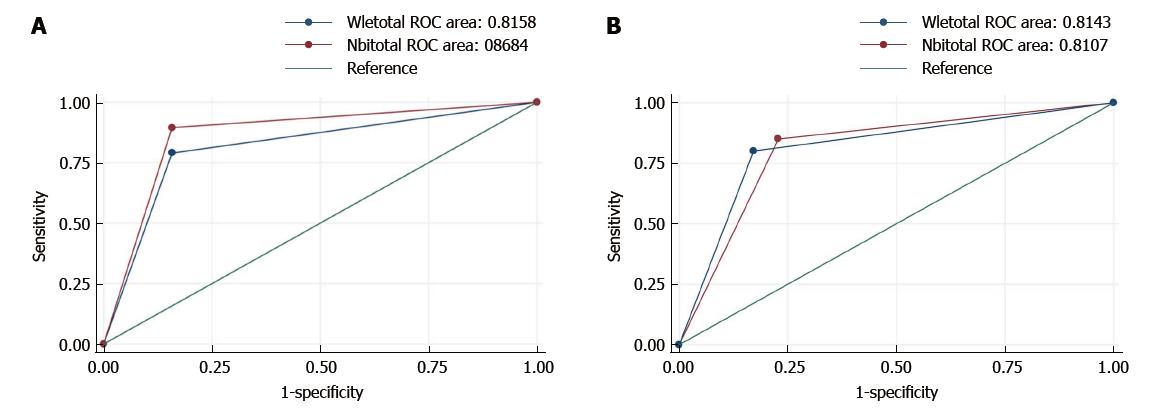
Figure 3 Receiver operating characteristic curve.
Global assessment of white light endoscopy (WLE) and narrow band imaging (NBI) is drawn for each group. A: WLE-NBI; B: NBI-WLE. The cut-off of the best area under the operating characteristic curve (ROC) curve is the true positive rate (sensitivity) plotted to the false positive rate (1.0-specificity). The closer the ROC curve to the upper left corner, the higher the accuracy of the test.
- Citation: Riu Pons F, Andreu M, Gimeno Beltran J, Álvarez-Gonzalez MA, Seoane Urgorri A, Dedeu JM, Barranco Priego L, Bessa X. Narrow band imaging and white light endoscopy in the characterization of a polypectomy scar: A single-blind observational study. World J Gastroenterol 2018; 24(45): 5179-5188
- URL: https://www.wjgnet.com/1007-9327/full/v24/i45/5179.htm
- DOI: https://dx.doi.org/10.3748/wjg.v24.i45.5179


