Copyright
©The Author(s) 2018.
World J Gastroenterol. Dec 7, 2018; 24(45): 5167-5178
Published online Dec 7, 2018. doi: 10.3748/wjg.v24.i45.5167
Published online Dec 7, 2018. doi: 10.3748/wjg.v24.i45.5167
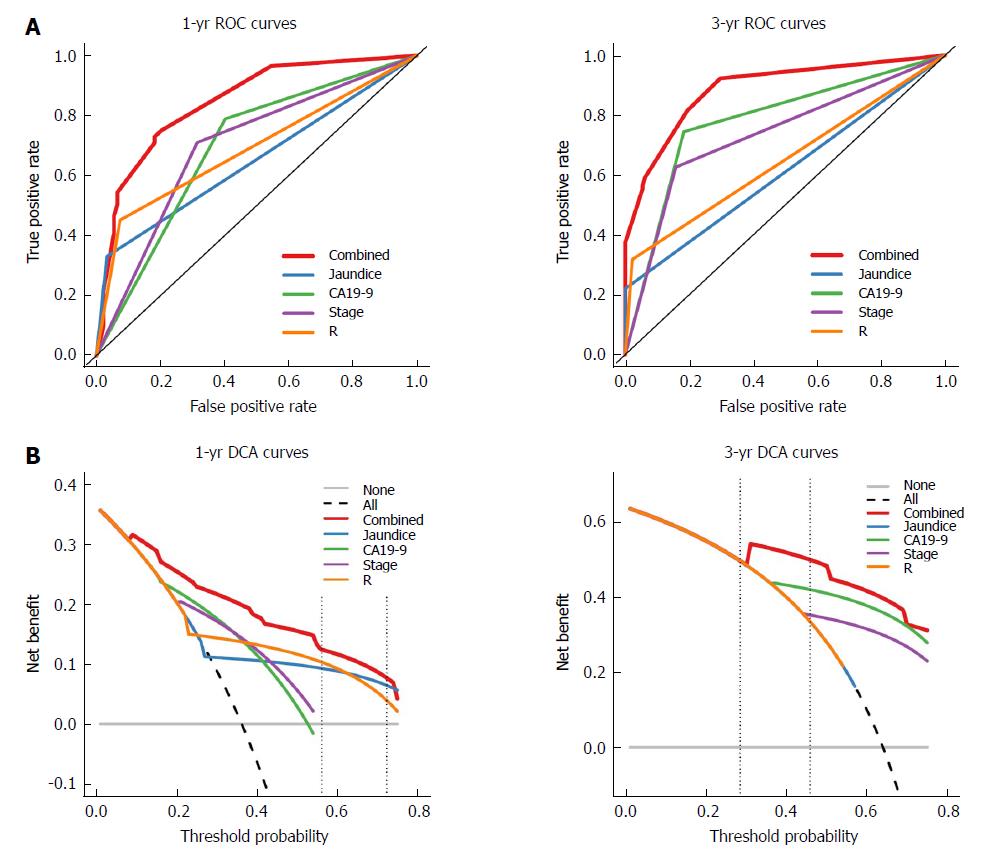
Figure 6 Receiver operating characteristic and decision curve analysis of the nomogram for 1- and 3-yr survival.
A: Time-dependent receiver operating characteristic curve analysis for the sensitivity and specificity of the nomograms. The combined nomogram (red solid line) had higher accuracy compared with the individual indicators; B: Time-dependent decision curve analysis for the clinical benefit of the nomograms and the corresponding scope of application. The black dotted line represents the assumption that all patients survive in the first and third year. The gray solid line represents the assumption that no patients survive in the first or third year. The red solid line represents the combined nomogram. The threshold probability between two vertical dashed lines represents the 95%CI of 1- and 3-yr survival probability in the null model. ROC: Receiver operating characteristic; DCA: Decision curve analysis.
- Citation: Bai Y, Liu ZS, Xiong JP, Xu WY, Lin JZ, Long JY, Miao F, Huang HC, Wan XS, Zhao HT. Nomogram to predict overall survival after gallbladder cancer resection in China. World J Gastroenterol 2018; 24(45): 5167-5178
- URL: https://www.wjgnet.com/1007-9327/full/v24/i45/5167.htm
- DOI: https://dx.doi.org/10.3748/wjg.v24.i45.5167


