Copyright
©The Author(s) 2018.
World J Gastroenterol. Dec 7, 2018; 24(45): 5167-5178
Published online Dec 7, 2018. doi: 10.3748/wjg.v24.i45.5167
Published online Dec 7, 2018. doi: 10.3748/wjg.v24.i45.5167
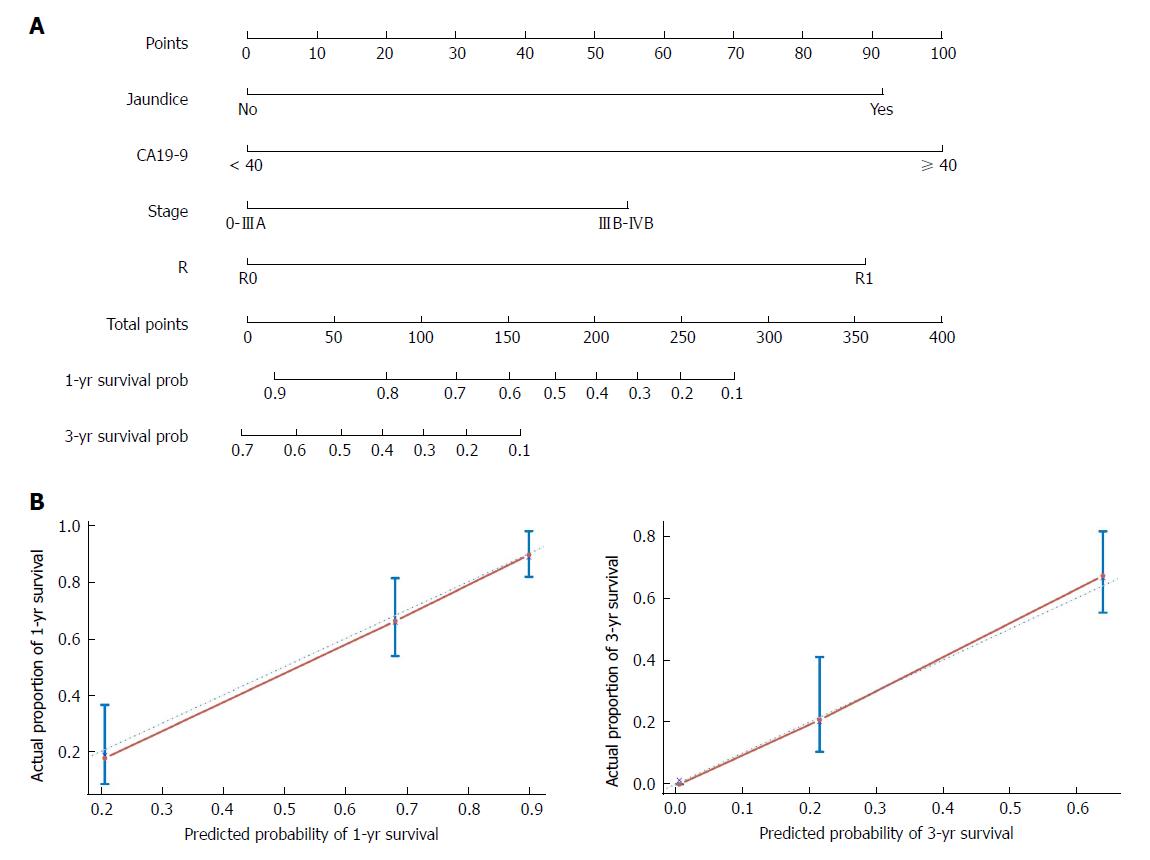
Figure 5 Nomogram and calibration plot.
A: A nomogram to predict the survival time of postsurgery gallbladder cancer (GBC) patients. Patient’s jaundice condition is located in the row labeled “Jaundice”, and a straight line is drawn up to the row labeled “Points” to determine the corresponding points. This process is then repeated for each of the remaining factors. After the total points are summed, a straight line is drawn from the appropriate total point number location to the rows labeled “1-yr survival prob” and “3-yr survival prob” to predict patient survival probability; B: Calibration curves for predicting 1- and 5-yr overall survival for GBC patients after radical resection. Actual survival measured via Kaplan-Meier analysis is shown on the Y-axis, and the nomogram-predicted survival is shown on the X-axis. CA19-9: Carbohydrate antigen 19-9.
- Citation: Bai Y, Liu ZS, Xiong JP, Xu WY, Lin JZ, Long JY, Miao F, Huang HC, Wan XS, Zhao HT. Nomogram to predict overall survival after gallbladder cancer resection in China. World J Gastroenterol 2018; 24(45): 5167-5178
- URL: https://www.wjgnet.com/1007-9327/full/v24/i45/5167.htm
- DOI: https://dx.doi.org/10.3748/wjg.v24.i45.5167


