Copyright
©The Author(s) 2018.
World J Gastroenterol. Dec 7, 2018; 24(45): 5167-5178
Published online Dec 7, 2018. doi: 10.3748/wjg.v24.i45.5167
Published online Dec 7, 2018. doi: 10.3748/wjg.v24.i45.5167
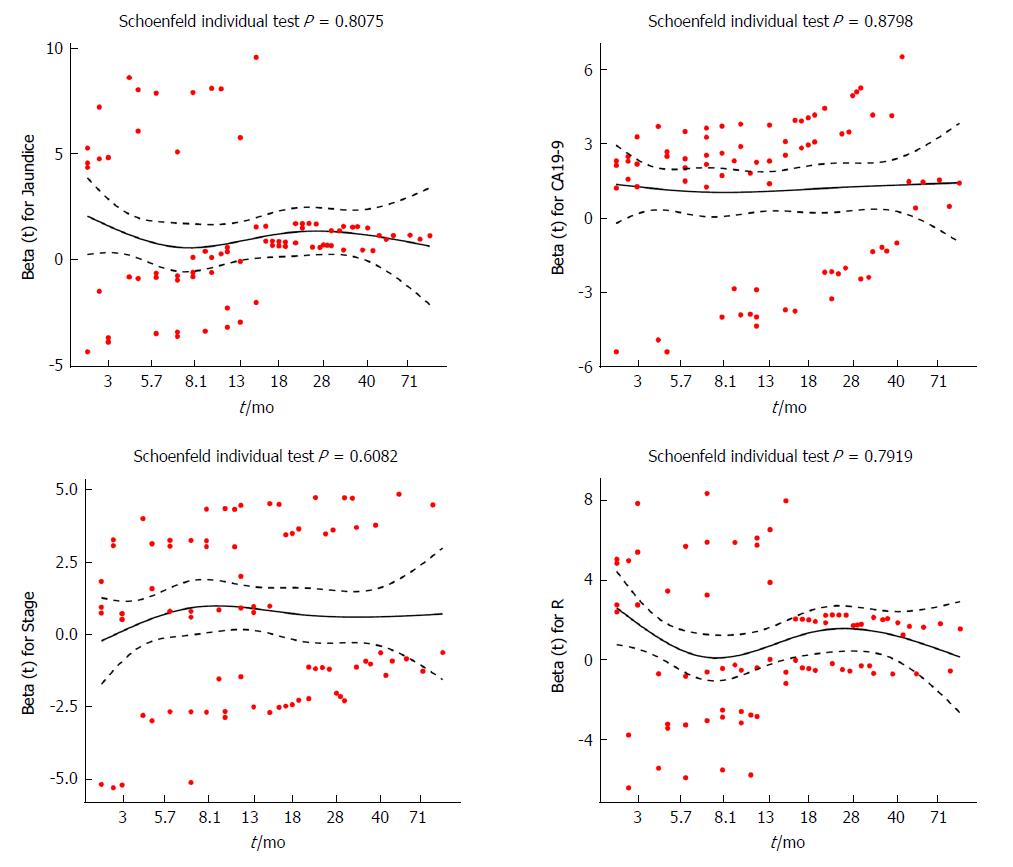
Figure 4 Schoenfeld residuals vs ranked survival time for selected predictors.
The X-axis represents the survival time, while the Beta values referring to jaundice, carbohydrate antigen 19-9, stage, and resection are shown on the Y-axis. CA19-9: Carbohydrate antigen 19-9; R: Resection.
- Citation: Bai Y, Liu ZS, Xiong JP, Xu WY, Lin JZ, Long JY, Miao F, Huang HC, Wan XS, Zhao HT. Nomogram to predict overall survival after gallbladder cancer resection in China. World J Gastroenterol 2018; 24(45): 5167-5178
- URL: https://www.wjgnet.com/1007-9327/full/v24/i45/5167.htm
- DOI: https://dx.doi.org/10.3748/wjg.v24.i45.5167


