Copyright
©The Author(s) 2018.
World J Gastroenterol. Dec 7, 2018; 24(45): 5167-5178
Published online Dec 7, 2018. doi: 10.3748/wjg.v24.i45.5167
Published online Dec 7, 2018. doi: 10.3748/wjg.v24.i45.5167
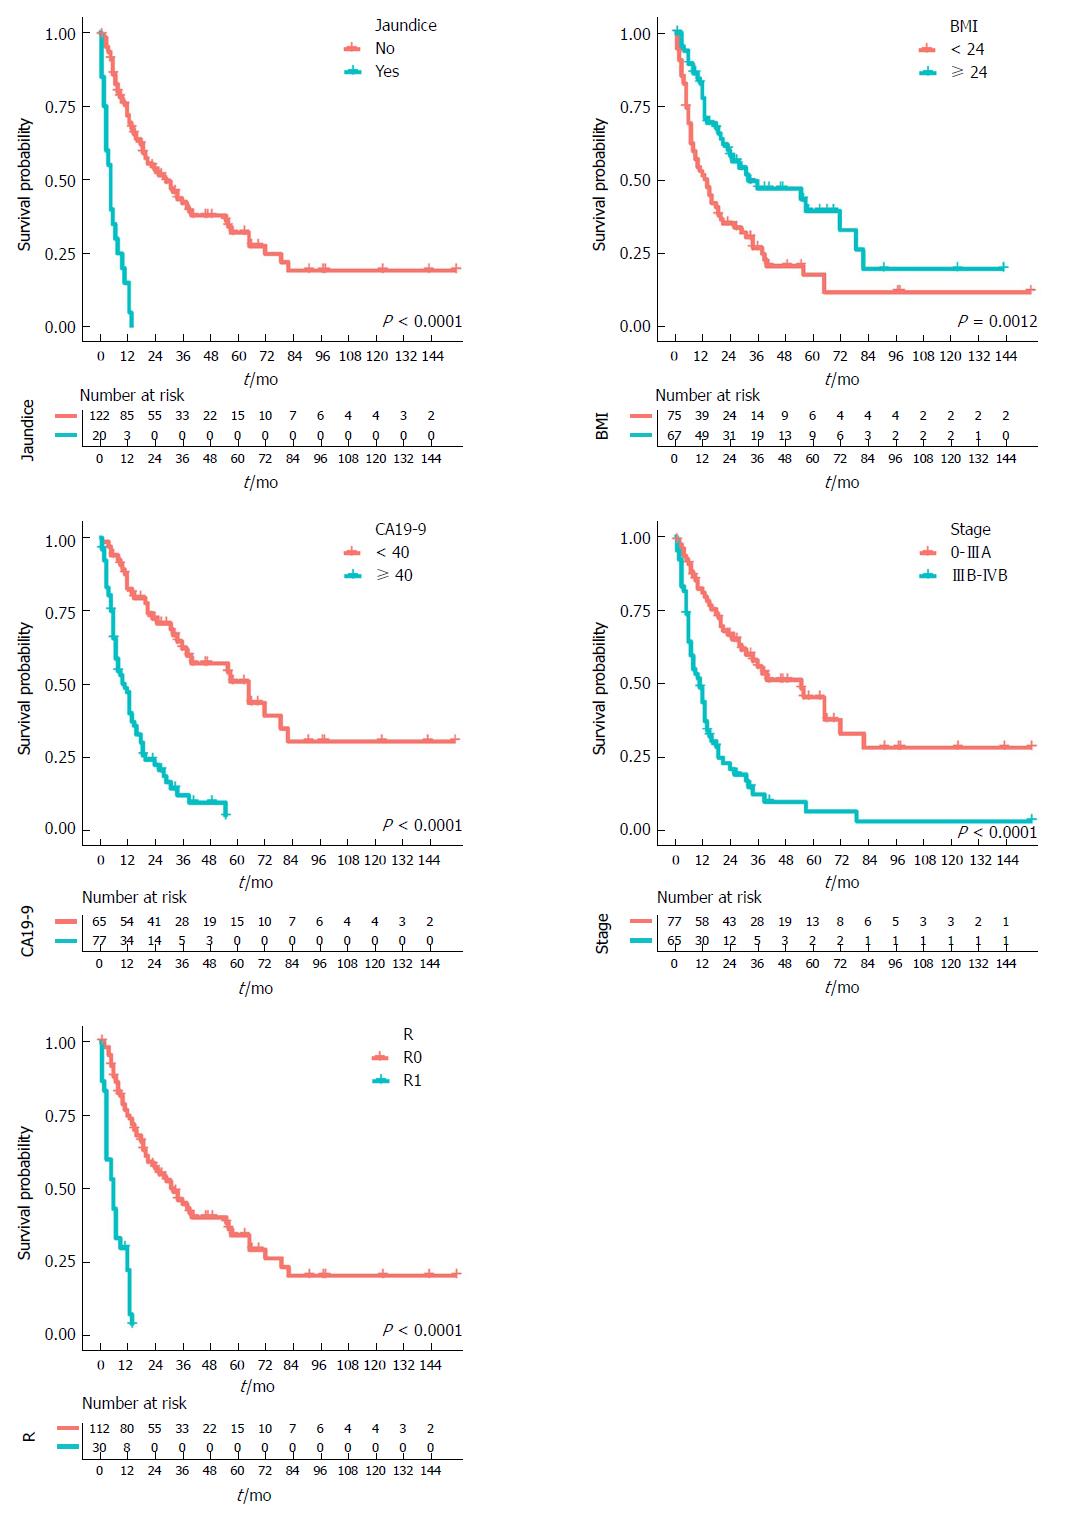
Figure 2 Kaplan-Meier survival curves for each predictor.
Kaplan-Meier survival curves showing the overall survival rates in gallbladder cancer patients according to different category types. All predictors are statistically significant (P-values are shown in the bottom right corner). Time-dependent numbers at risk are listed at the bottom. BMI: Body mass index; CA19-9: Carbohydrate antigen 19-9; R: Resection.
- Citation: Bai Y, Liu ZS, Xiong JP, Xu WY, Lin JZ, Long JY, Miao F, Huang HC, Wan XS, Zhao HT. Nomogram to predict overall survival after gallbladder cancer resection in China. World J Gastroenterol 2018; 24(45): 5167-5178
- URL: https://www.wjgnet.com/1007-9327/full/v24/i45/5167.htm
- DOI: https://dx.doi.org/10.3748/wjg.v24.i45.5167


