Copyright
©The Author(s) 2018.
World J Gastroenterol. Dec 7, 2018; 24(45): 5095-5108
Published online Dec 7, 2018. doi: 10.3748/wjg.v24.i45.5095
Published online Dec 7, 2018. doi: 10.3748/wjg.v24.i45.5095
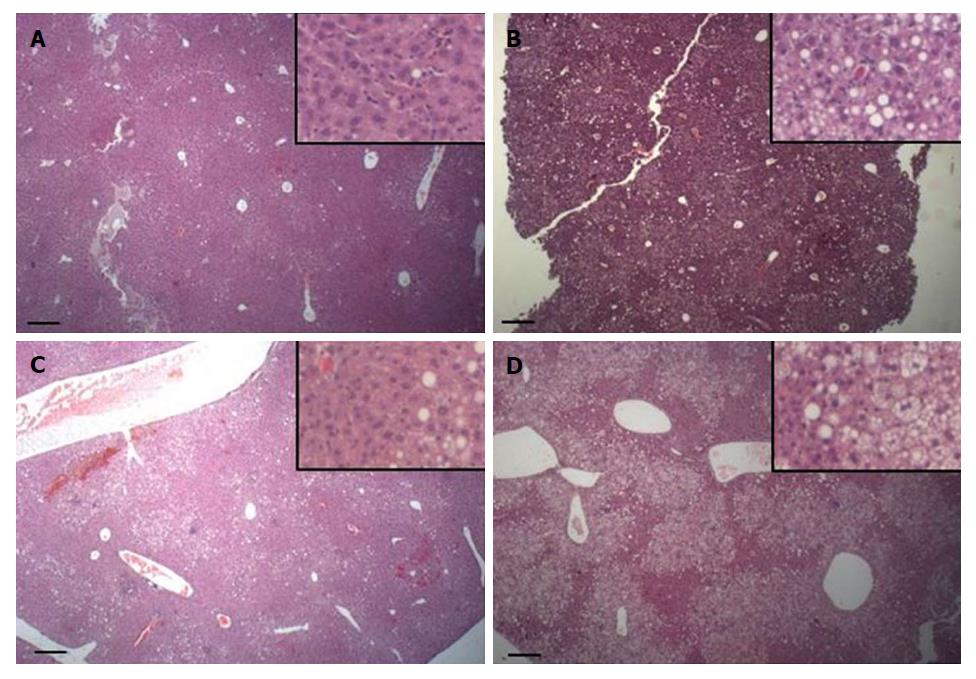
Figure 5 Histological sections of livers (HE) of mice fed a high-fat diet for 12 wk.
A and C: Hydrogen-rich water (HRW) group; B and D: Regular water (RW) group. Each row shows sections of different mice that reached a similar weight at the end of the experiment. Note the pronounced steatosis in mice that drank RW in compare to mice of the same weight that drank HRW. Insert detail of each section. Bar = 200 μm HWR: Hydrogen-rich water; RW: Regular water.
- Citation: Jackson K, Dressler N, Ben-Shushan RS, Meerson A, LeBaron TW, Tamir S. Effects of alkaline-electrolyzed and hydrogen-rich water, in a high-fat-diet nonalcoholic fatty liver disease mouse model. World J Gastroenterol 2018; 24(45): 5095-5108
- URL: https://www.wjgnet.com/1007-9327/full/v24/i45/5095.htm
- DOI: https://dx.doi.org/10.3748/wjg.v24.i45.5095


