Copyright
©The Author(s) 2018.
World J Gastroenterol. Dec 7, 2018; 24(45): 5095-5108
Published online Dec 7, 2018. doi: 10.3748/wjg.v24.i45.5095
Published online Dec 7, 2018. doi: 10.3748/wjg.v24.i45.5095
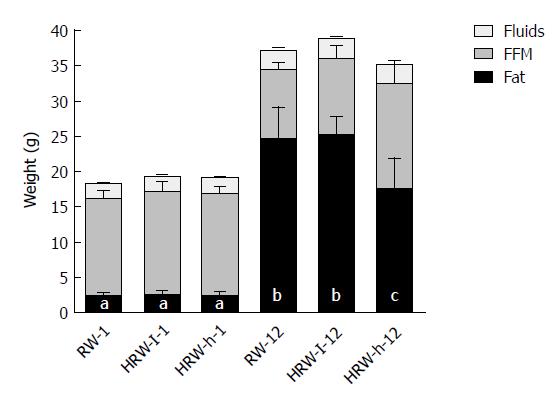
Figure 4 Body mass composition: Fat, fluids and free fatty mass at weeks 1 (first three columns) and 12 (last three columns), (n = 8).
Data are expressed as mean ± SD. Different letters show a significant difference in fat content (Mann Whitney and Kruskal-Wallis P < 0.05). RW: Regular water; HRW-I: Hydrogen-rich water low concentration; HRW-h: Hydrogen-rich water high concentration).
- Citation: Jackson K, Dressler N, Ben-Shushan RS, Meerson A, LeBaron TW, Tamir S. Effects of alkaline-electrolyzed and hydrogen-rich water, in a high-fat-diet nonalcoholic fatty liver disease mouse model. World J Gastroenterol 2018; 24(45): 5095-5108
- URL: https://www.wjgnet.com/1007-9327/full/v24/i45/5095.htm
- DOI: https://dx.doi.org/10.3748/wjg.v24.i45.5095


