Copyright
©The Author(s) 2018.
World J Gastroenterol. Nov 28, 2018; 24(44): 5034-5045
Published online Nov 28, 2018. doi: 10.3748/wjg.v24.i44.5034
Published online Nov 28, 2018. doi: 10.3748/wjg.v24.i44.5034
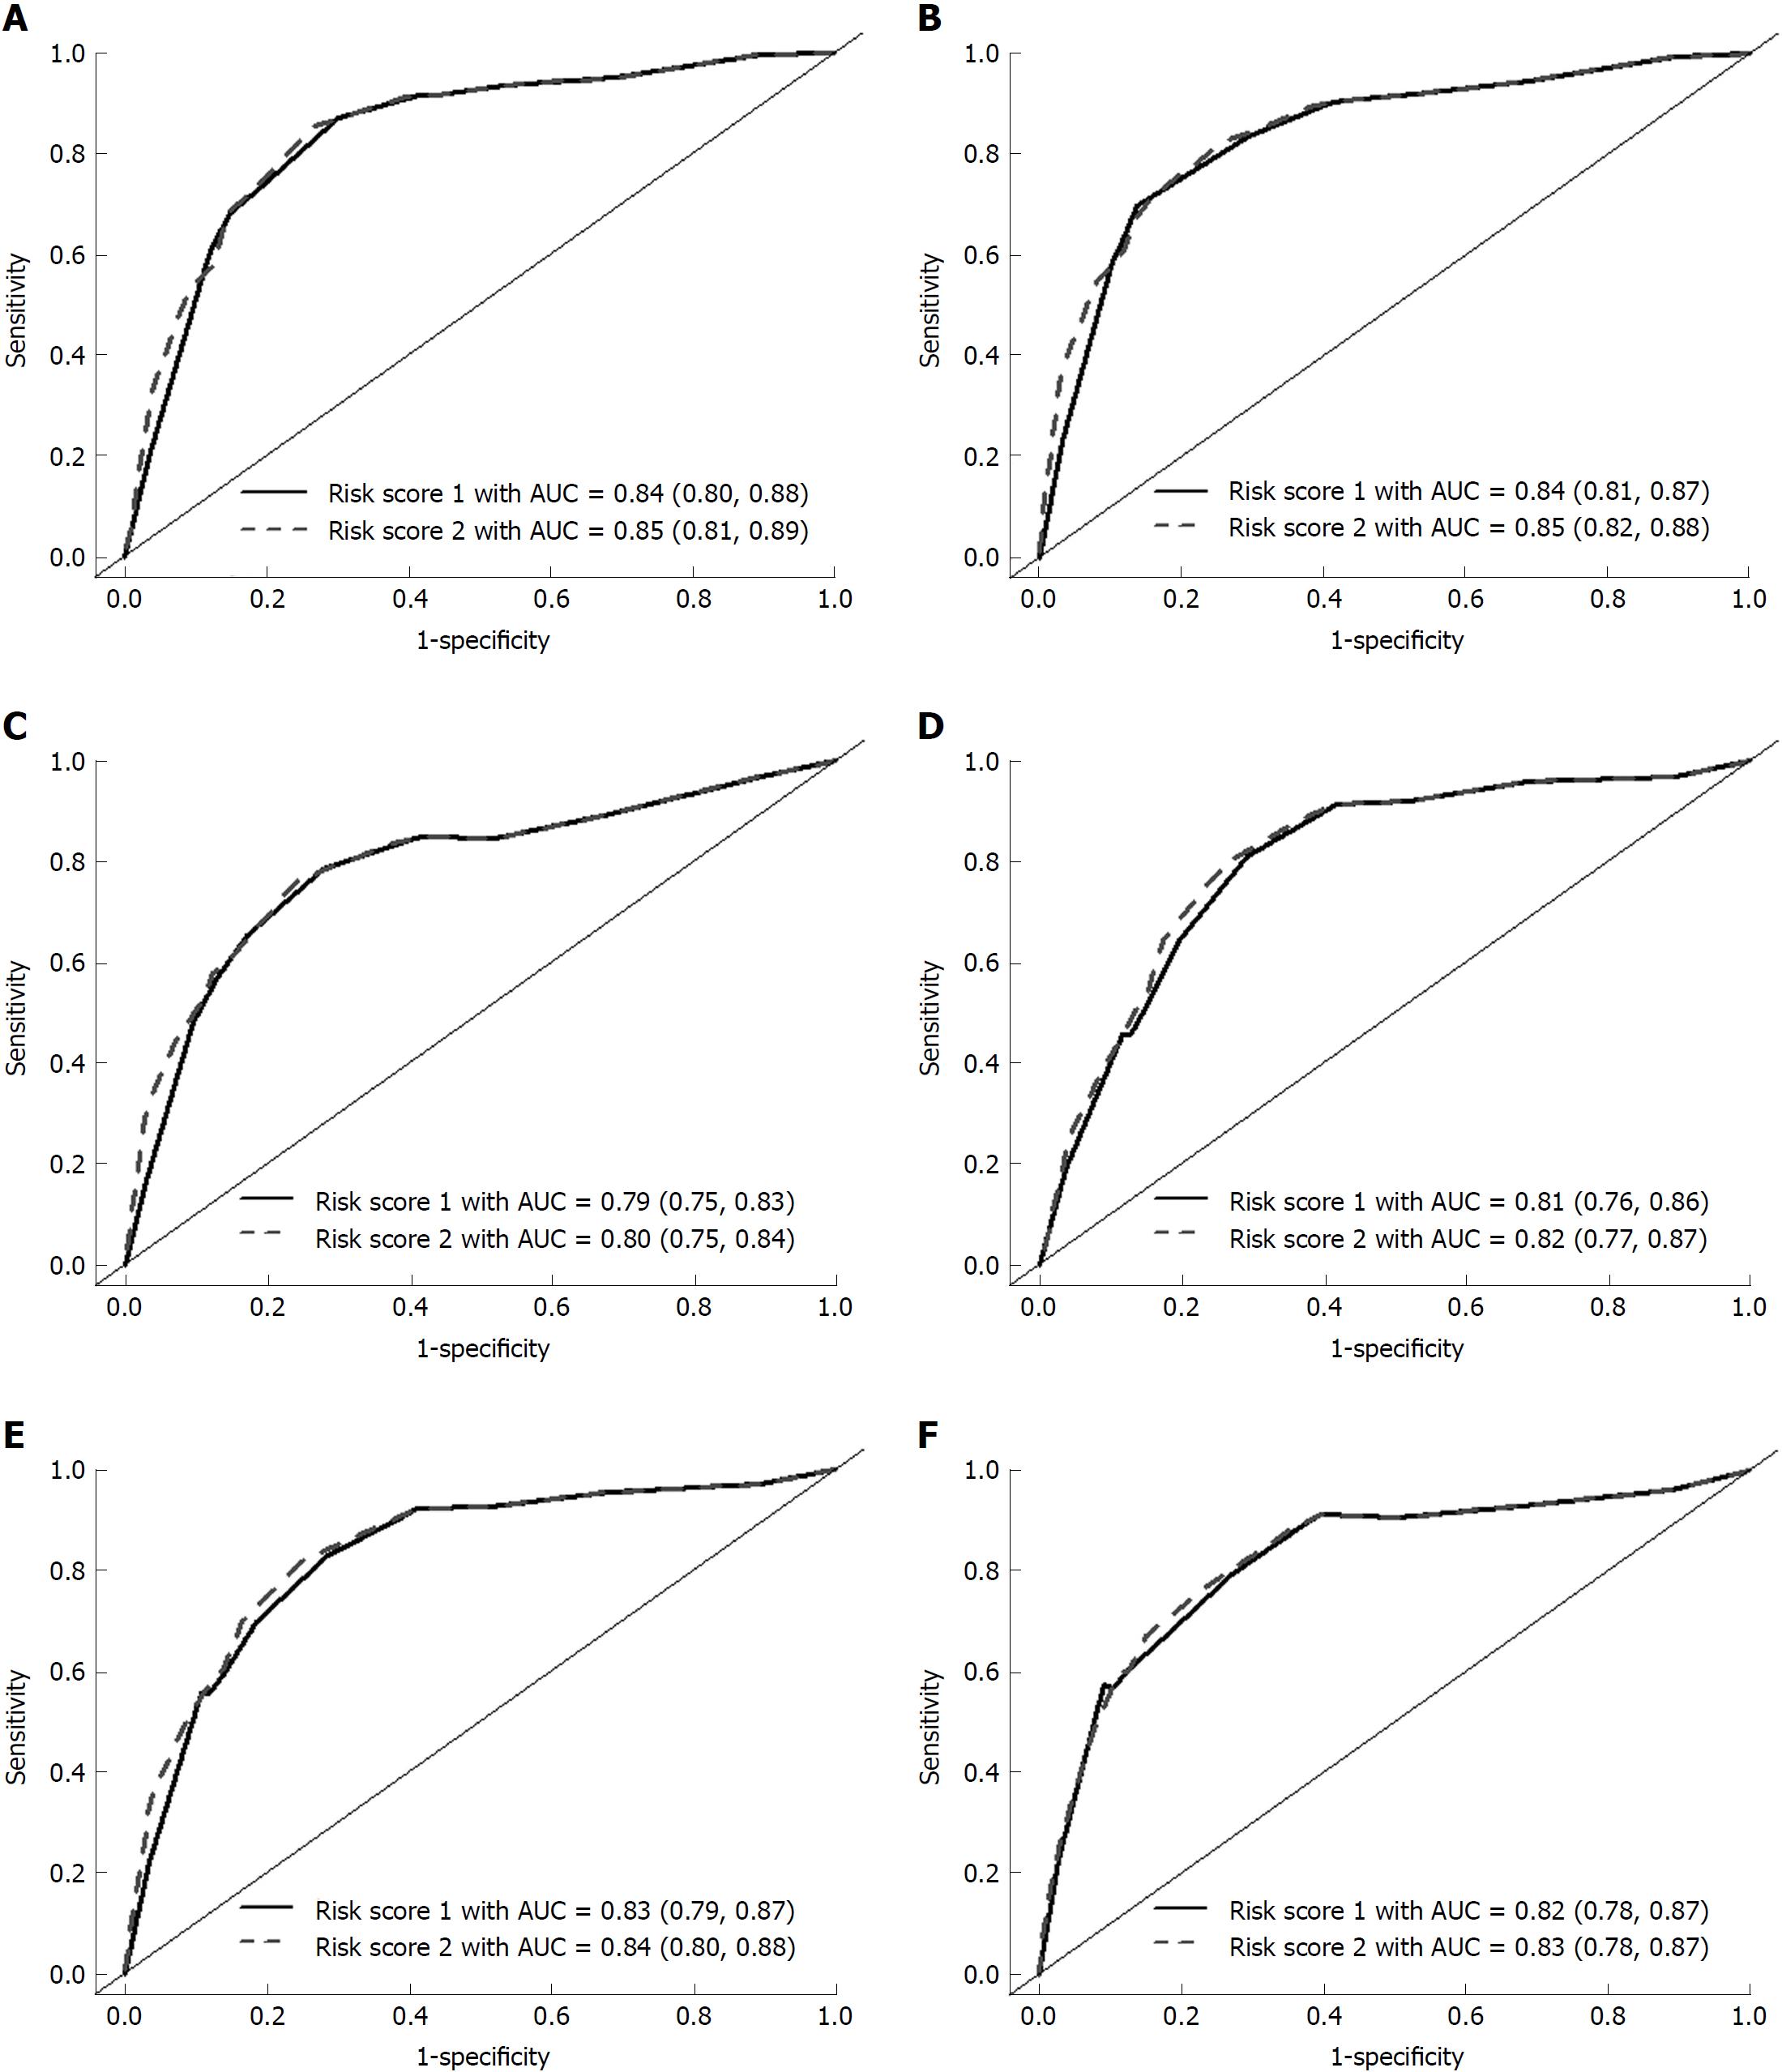
Figure 2 Area under the curve and 95% confidence interval at different time endpoints for risk score in derivation and validation cohorts.
Data are presented as area under the curve (95% confidence interval). A: Discrimination of risk score 1 and risk score 2 for predicting 3-year chronic pancreatitis incidence in derivation cohort. B: Discrimination of risk score 1 and risk score 2 for predicting 5-year chronic pancreatitis incidence in derivation cohort. C: Discrimination of risk score 1 and risk score 2 for predicting overall chronic pancreatitis incidence in derivation cohort. D: Discrimination of risk score 1 and risk score 2 for predicting 3-year chronic pancreatitis incidence in validation cohort. E: Discrimination of risk score 1 and risk score 2 for predicting 5-year chronic pancreatitis incidence in validation cohort. F: Discrimination of risk score 1 and risk score 2 for predicting overall chronic pancreatitis incidence in validation cohort. AUC: Area under the curve; ROC: Receiver operating characteristic.
- Citation: Lin YC, Kor CT, Su WW, Hsu YC. Risk factors and prediction score for chronic pancreatitis: A nationwide population-based cohort study. World J Gastroenterol 2018; 24(44): 5034-5045
- URL: https://www.wjgnet.com/1007-9327/full/v24/i44/5034.htm
- DOI: https://dx.doi.org/10.3748/wjg.v24.i44.5034


