Copyright
©The Author(s) 2018.
World J Gastroenterol. Nov 21, 2018; 24(43): 4906-4919
Published online Nov 21, 2018. doi: 10.3748/wjg.v24.i43.4906
Published online Nov 21, 2018. doi: 10.3748/wjg.v24.i43.4906
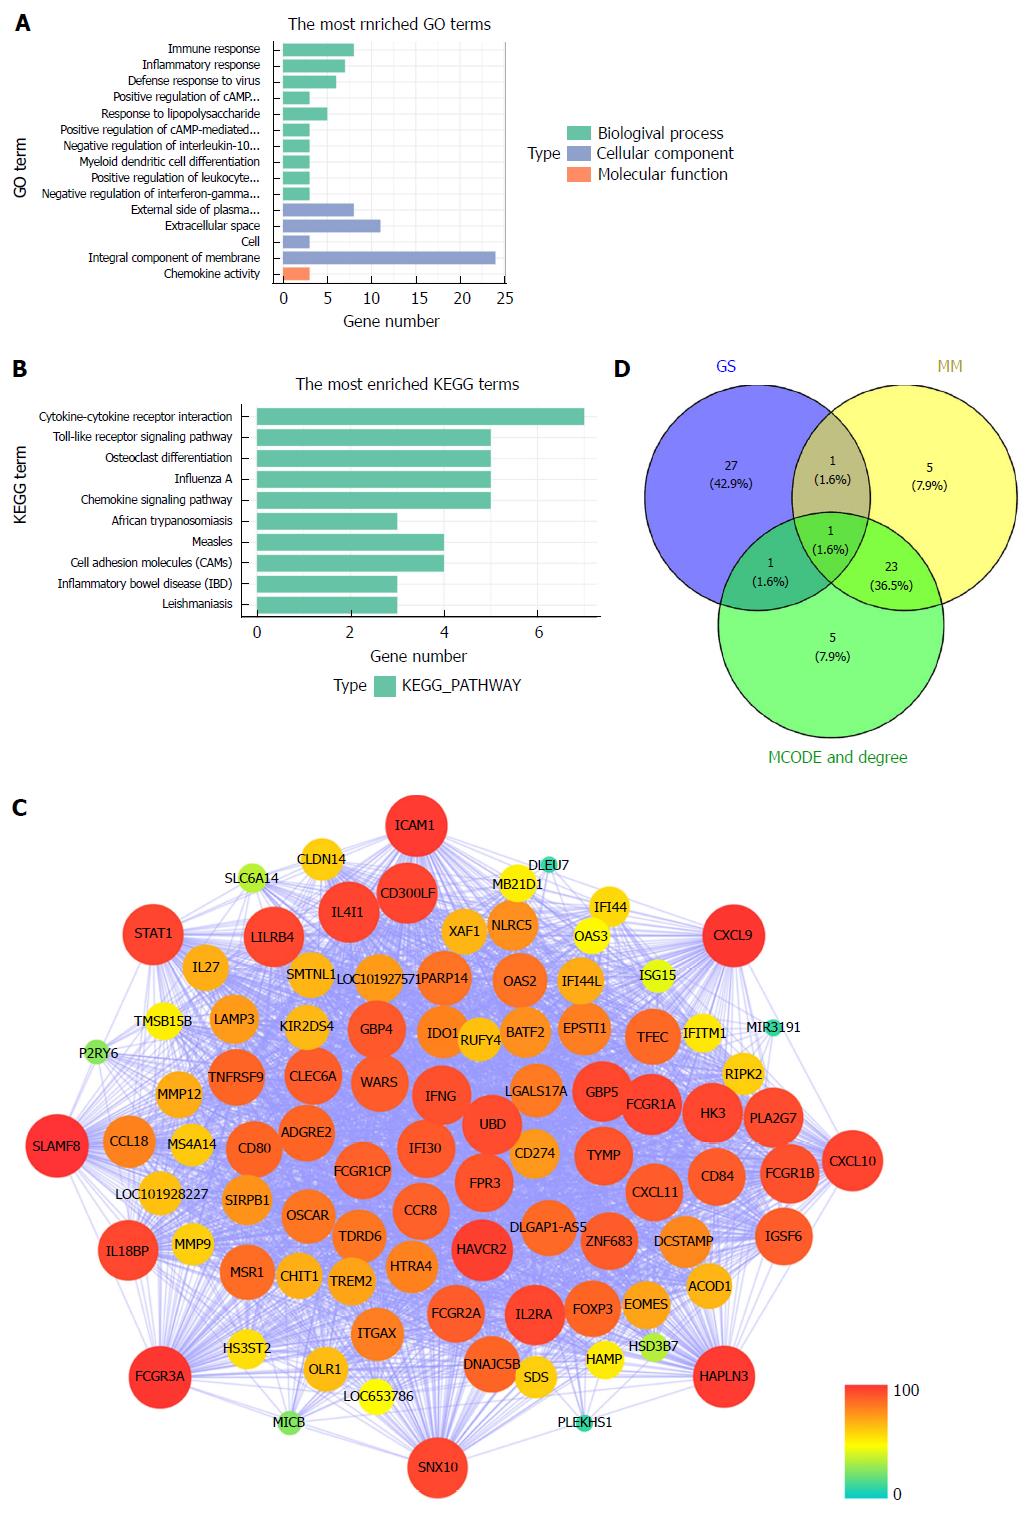
Figure 4 Module functional annotation and hub gene identification.
A and B: Gene Ontology (GO) functional and Kyoto Encyclopedia of Genes and Genomes (KEGG) pathway analysis for genes in the tan-module. The X-axis shows the number of genes and the Y-axis shows the GO and KEGG terms; C: Weighted co-expression network for tan-module genes. (nodes are colored according to the degree, and sized according to the Molecular Complex Detection (MCODE) score); D: Hub genes were screened with module membership (MM), gene significance (GS) and MCODE. GO: Gene Ontology; KEGG: Kyoto Encyclopedia of Genes and Genomes; GS: Gene significance; MM: Module membership; MCODE: Molecular Complex Detection.
- Citation: Zhang J, Wu Y, Jin HY, Guo S, Dong Z, Zheng ZC, Wang Y, Zhao Y. Prognostic value of sorting nexin 10 weak expression in stomach adenocarcinoma revealed by weighted gene co-expression network analysis. World J Gastroenterol 2018; 24(43): 4906-4919
- URL: https://www.wjgnet.com/1007-9327/full/v24/i43/4906.htm
- DOI: https://dx.doi.org/10.3748/wjg.v24.i43.4906


