Copyright
©The Author(s) 2018.
World J Gastroenterol. Nov 21, 2018; 24(43): 4906-4919
Published online Nov 21, 2018. doi: 10.3748/wjg.v24.i43.4906
Published online Nov 21, 2018. doi: 10.3748/wjg.v24.i43.4906
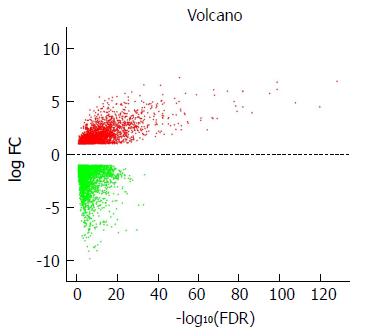
Figure 1 Volcano plot of the differentially expressed mRNAs between stomach adenocarcinoma and para-carcinoma tissues.
Red indicates high expression and green indicates low expression (|log2FC| > 1 and adjusted P value < 0.05). The X axis represents a false discovery rate (FDR) value and the Y axis represents a log2FC. Differential mRNAs were calculated by edgeR. There were 2456 highly expressed and 3775 lowly expressed mRNAs. This volcano plot was conducted by the ggplot2 package of R language. FDR: False discovery rate.
- Citation: Zhang J, Wu Y, Jin HY, Guo S, Dong Z, Zheng ZC, Wang Y, Zhao Y. Prognostic value of sorting nexin 10 weak expression in stomach adenocarcinoma revealed by weighted gene co-expression network analysis. World J Gastroenterol 2018; 24(43): 4906-4919
- URL: https://www.wjgnet.com/1007-9327/full/v24/i43/4906.htm
- DOI: https://dx.doi.org/10.3748/wjg.v24.i43.4906


