Copyright
©The Author(s) 2018.
World J Gastroenterol. Nov 21, 2018; 24(43): 4880-4892
Published online Nov 21, 2018. doi: 10.3748/wjg.v24.i43.4880
Published online Nov 21, 2018. doi: 10.3748/wjg.v24.i43.4880
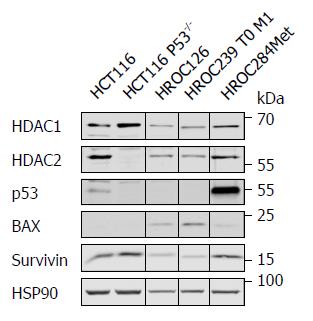
Figure 3 Expression of p53 and some of its targets in individual rectal cancer cell lines.
Western blot analysis of untreated HROC126, HROC239 T0 M1 and HROC284Met cells compared to HCT116 (p53 wildtype) and HCT116 p53-/- was performed. The levels of HDAC1, HDAC2, p53, BAX and survivin were assessed using specific antibodies. HSP90 was used as loading control.
- Citation: Gock M, Mullins CS, Bergner C, Prall F, Ramer R, Göder A, Krämer OH, Lange F, Krause BJ, Klar E, Linnebacher M. Establishment, functional and genetic characterization of three novel patient-derived rectal cancer cell lines. World J Gastroenterol 2018; 24(43): 4880-4892
- URL: https://www.wjgnet.com/1007-9327/full/v24/i43/4880.htm
- DOI: https://dx.doi.org/10.3748/wjg.v24.i43.4880


