Copyright
©The Author(s) 2018.
World J Gastroenterol. Nov 14, 2018; 24(42): 4787-4797
Published online Nov 14, 2018. doi: 10.3748/wjg.v24.i42.4787
Published online Nov 14, 2018. doi: 10.3748/wjg.v24.i42.4787
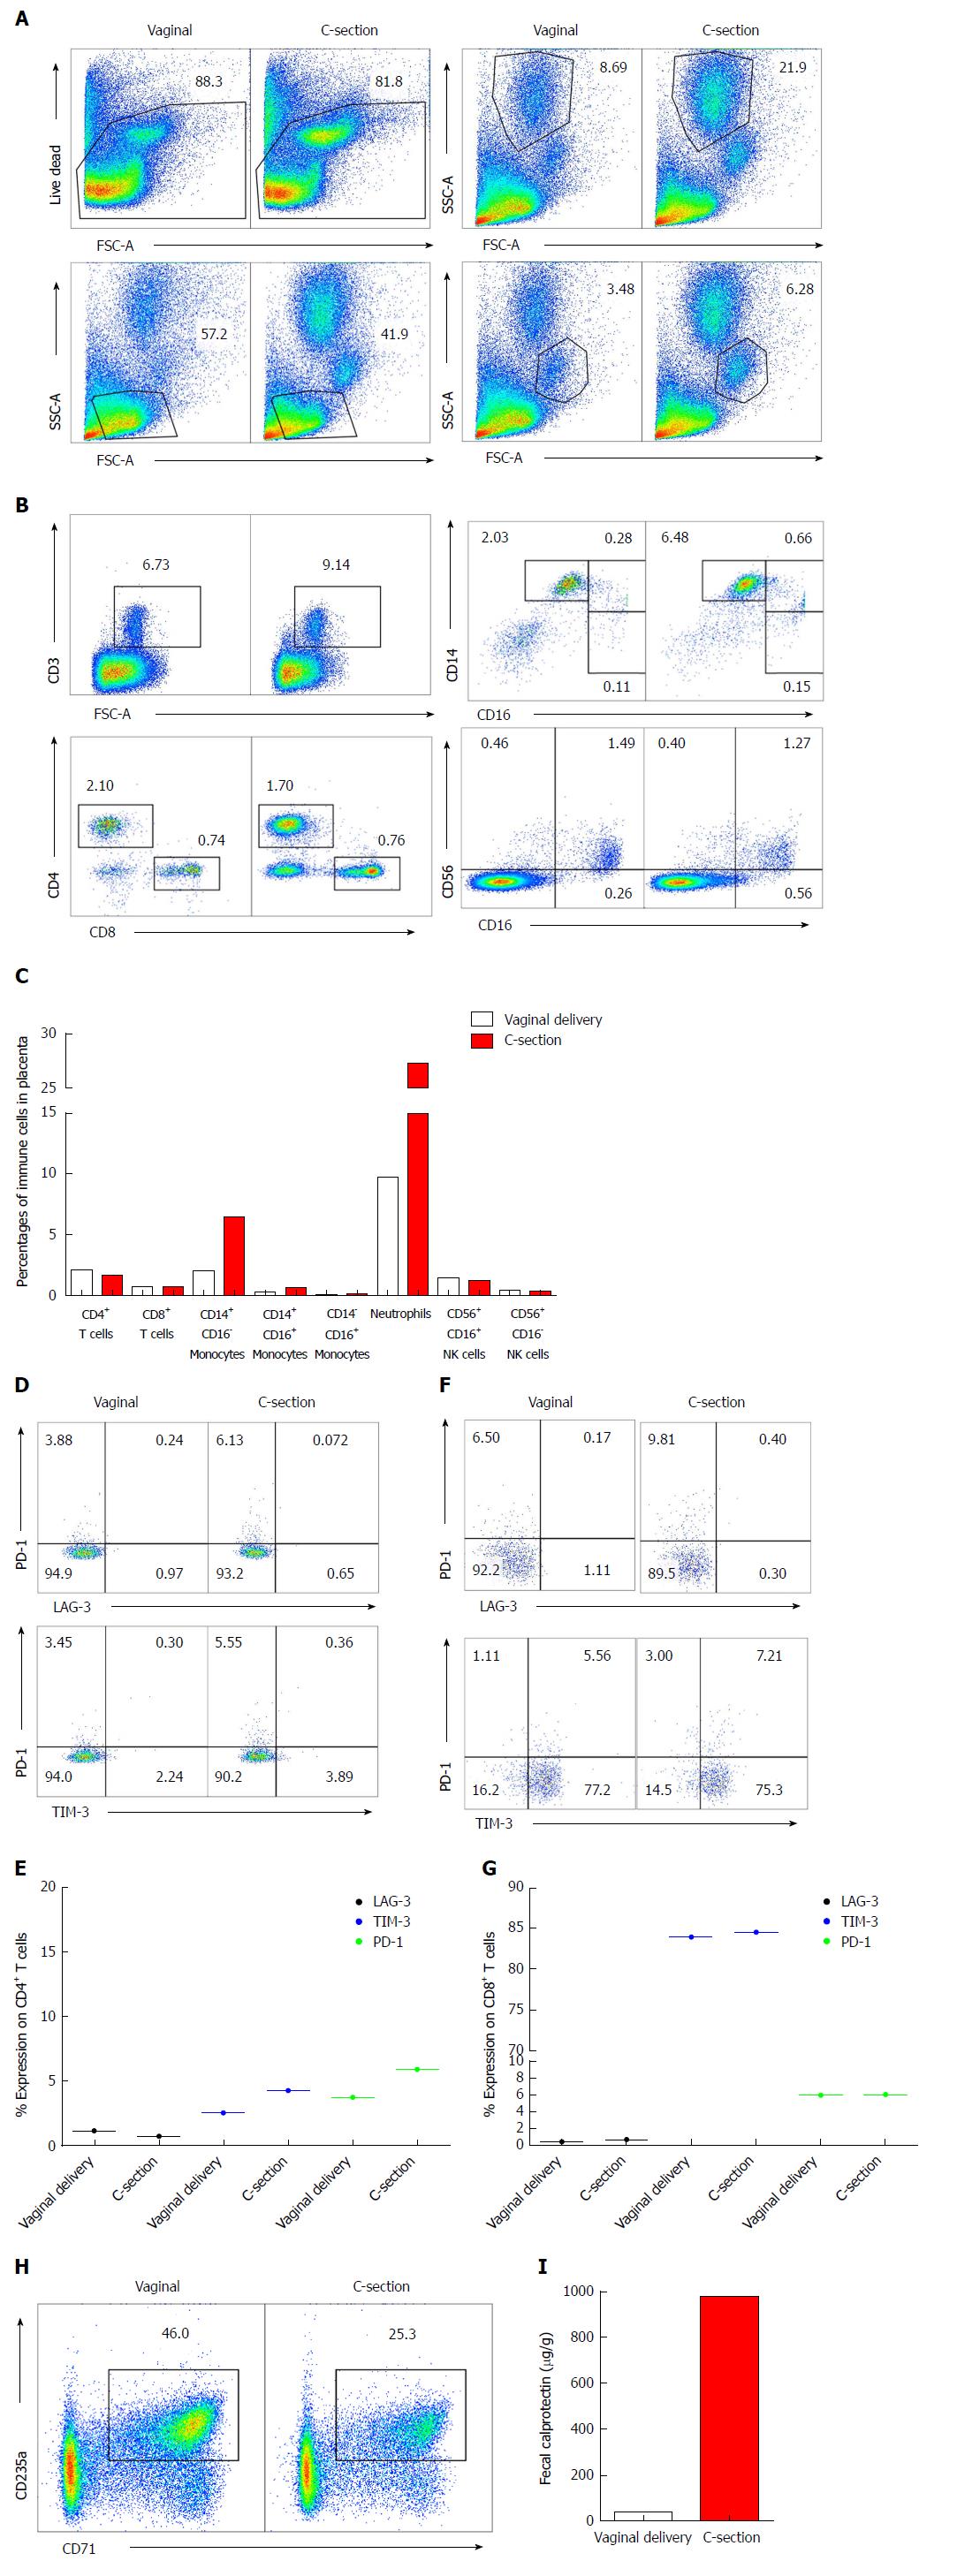
Figure 2 Immunophenotyping of placental cells.
A: Showing flow cytometry gating strategy for different immune cells in placenta. B: Representative dot plots showing T cells (CD3, CD4 and CD8), monocytes (CD14 and CD16) and NK cells (CD56 and CD16) in placenta of vaginally or C-section delivered newborns. C: Cumulative data showing percentages of different immune cells in placenta. D: Representative dot plots showing expression of PD-1/LAG-3 and PD-1/TIM-3 on CD4+ T cells. E: Percentages of PD-1, LAG-3 and TIM-3 on CD4+ T cells from placental tissues of twins. F: Representative dot plots showing expression of PD-1/LAG-3 and PD-1/TIM-3 on CD8+ T cells. G: Percentages of PD-1, LAG-3 and TIM-3 on CD8+ T cells from placental tissues of twins. H: Representative dot plots showing percentages of CD71+CD235+ cells in placental tissues of vaginally vs C-section delivered twins. I: Data showing levels of FCP in fecal samples of twins as measured by ELISA. NK: Natural killer; C-section: Caesarean section; PD-1: Program death-1; LAG-3: Lymphocyte-activation gene 3; TIM-3: T-cell immunoglobulin and mucin-domain containing-3; FCP: Fecal calprotectin; ELISA: Enzyme-linked immuno sorbent assay.
- Citation: Dunsmore G, Koleva P, Sutton RT, Ambrosio L, Huang V, Elahi S. Mode of delivery by an ulcerative colitis mother in a case of twins: Immunological differences in cord blood and placenta. World J Gastroenterol 2018; 24(42): 4787-4797
- URL: https://www.wjgnet.com/1007-9327/full/v24/i42/4787.htm
- DOI: https://dx.doi.org/10.3748/wjg.v24.i42.4787


