Copyright
©The Author(s) 2018.
World J Gastroenterol. Jan 28, 2018; 24(4): 494-503
Published online Jan 28, 2018. doi: 10.3748/wjg.v24.i4.494
Published online Jan 28, 2018. doi: 10.3748/wjg.v24.i4.494
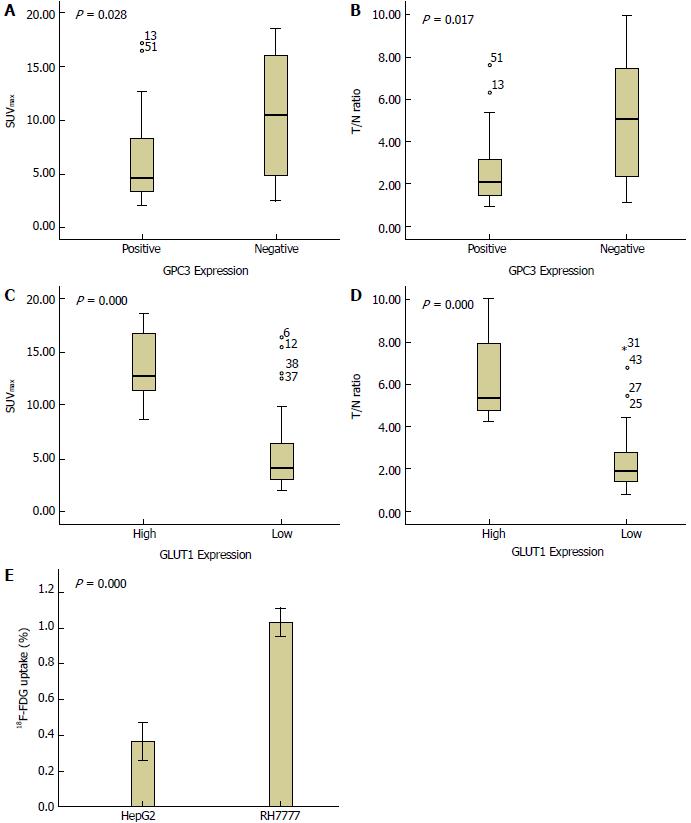
Figure 1 The relationship of18F-FDG uptake with GPC3 and GLUT1 expression, and the cellular 18F-FDG uptake assay.
A and B: 18F-FDG uptake in hepatocellular carcinoma (HCC) lesions with positive and negative GPC3 expression. (A) SUVmax: 6.01 ± 3.55 vs 9.56 ± 5.95, t = -2.341, P = 0.028; (B) T/NT ratio: 2.62 ± 1.55 vs 4.52 ± 2.92, t = -2.597, P = 0.017. C and D: 18F-FDG uptake in HCC lesions with high and low expression of GLUT1. (C) SUVmax: 13.58 ± 3.44 vs 5.57 ± 3.49, t = 6.898, P < 0.001; (D) T/NT ratio: 6.38 ± 1.91 vs 2.46 ± 1.55, t = 6.307, P < 0.001). E: 18F-FDG uptake in GPC3-expressing HepG2 cells and non-GPC3-expressing RH7777 cells (0.37% ± 0.05% vs 1.03% ± 0.04% of inputted radioactivity, t = -20.352, P < 0.001).
- Citation: Li YC, Yang CS, Zhou WL, Li HS, Han YJ, Wang QS, Wu HB. Low glucose metabolism in hepatocellular carcinoma with GPC3 expression. World J Gastroenterol 2018; 24(4): 494-503
- URL: https://www.wjgnet.com/1007-9327/full/v24/i4/494.htm
- DOI: https://dx.doi.org/10.3748/wjg.v24.i4.494


