Copyright
©The Author(s) 2018.
World J Gastroenterol. Jan 28, 2018; 24(4): 461-474
Published online Jan 28, 2018. doi: 10.3748/wjg.v24.i4.461
Published online Jan 28, 2018. doi: 10.3748/wjg.v24.i4.461
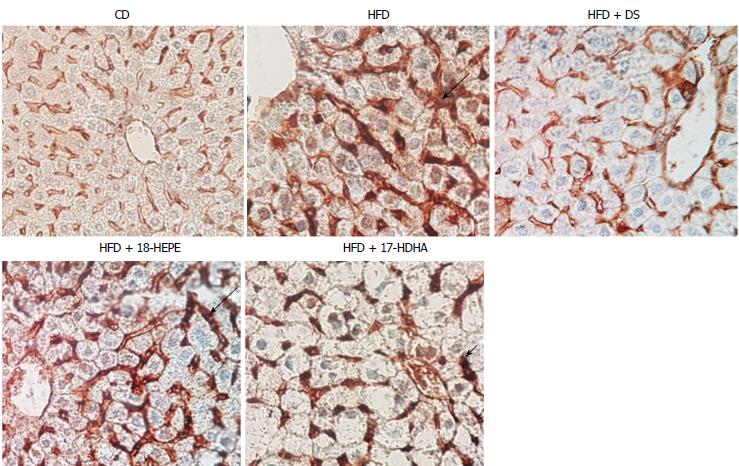
Figure 9 Expression of mouse smooth muscle actin in liver tissue.
Representative photomicrographs (Magnification × 40) Immunohistochemistry for α-smooth muscle actin (SMA). Arrows show area in which the expression is marked. SMA expression was determined to analyze early development of fibrosis. HFD group showed an augmented expression of SMA along the perisinusoidal space in compared to CD group. Noteworthy, HFD + DS and HFD + 17-HDHA showed a pronounced reduction, whereas HFD + 18-HEPE groups displayed only a modest decrease.
- Citation: Rodriguez-Echevarria R, Macias-Barragan J, Parra-Vargas M, Davila-Rodriguez JR, Amezcua-Galvez E, Armendariz-Borunda J. Diet switch and omega-3 hydroxy-fatty acids display differential hepatoprotective effects in an obesity/nonalcoholic fatty liver disease model in mice. World J Gastroenterol 2018; 24(4): 461-474
- URL: https://www.wjgnet.com/1007-9327/full/v24/i4/461.htm
- DOI: https://dx.doi.org/10.3748/wjg.v24.i4.461


