Copyright
©The Author(s) 2018.
World J Gastroenterol. Oct 21, 2018; 24(39): 4510-4516
Published online Oct 21, 2018. doi: 10.3748/wjg.v24.i39.4510
Published online Oct 21, 2018. doi: 10.3748/wjg.v24.i39.4510
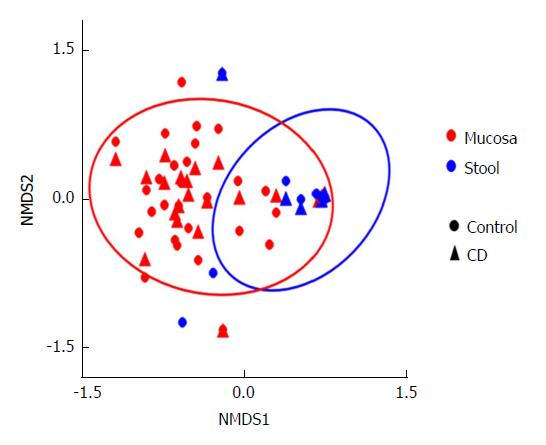
Figure 3 Beta diversity evaluated by Bray-Curtis distance and illustrated by the NMDS plot.
This is a measure of beta diversity, and quantifies the similarity in abundance of taxa between samples. The ovals contain 95% of the probabilities for mucosa and stool. This plot shows a clear separation of mucosa and stool samples (P = 0.005). NMDS: Nonparametric multidimensional scaling; CD: Crohn’s disease.
- Citation: El Mouzan MI, Korolev KS, Al Mofarreh MA, Menon R, Winter HS, Al Sarkhy AA, Dowd SE, Al Barrag AM, Assiri AA. Fungal dysbiosis predicts the diagnosis of pediatric Crohn’s disease. World J Gastroenterol 2018; 24(39): 4510-4516
- URL: https://www.wjgnet.com/1007-9327/full/v24/i39/4510.htm
- DOI: https://dx.doi.org/10.3748/wjg.v24.i39.4510


