Copyright
©The Author(s) 2018.
World J Gastroenterol. Oct 21, 2018; 24(39): 4510-4516
Published online Oct 21, 2018. doi: 10.3748/wjg.v24.i39.4510
Published online Oct 21, 2018. doi: 10.3748/wjg.v24.i39.4510
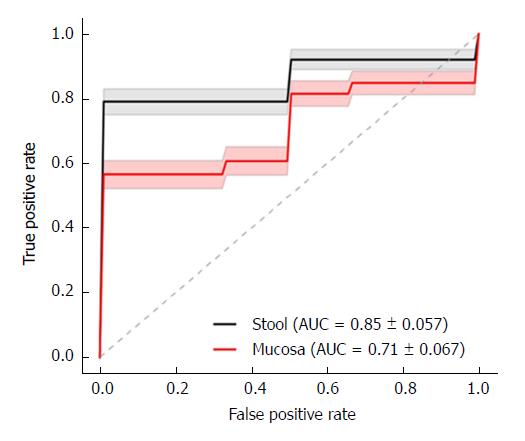
Figure 1 Dysbiosis score classification curve to distinguish between children with Crohn’s disease and controls.
The receiver operating characteristic (ROC) curve demonstrated the logistic regression dysbiosis classifier. The mean ROC curve for stool (solid black line) and mucosal (solid red line) dysbiosis scores in fungi cohorts is shown. The standard deviation from 100 permutations is shown in gray and light red shading. The area under the curve for stool dysbiosis is significantly higher than in mucosal dysbiosis, using a Fisher’s t-test computed P < 0.001.
- Citation: El Mouzan MI, Korolev KS, Al Mofarreh MA, Menon R, Winter HS, Al Sarkhy AA, Dowd SE, Al Barrag AM, Assiri AA. Fungal dysbiosis predicts the diagnosis of pediatric Crohn’s disease. World J Gastroenterol 2018; 24(39): 4510-4516
- URL: https://www.wjgnet.com/1007-9327/full/v24/i39/4510.htm
- DOI: https://dx.doi.org/10.3748/wjg.v24.i39.4510


