Copyright
©The Author(s) 2018.
World J Gastroenterol. Oct 21, 2018; 24(39): 4499-4509
Published online Oct 21, 2018. doi: 10.3748/wjg.v24.i39.4499
Published online Oct 21, 2018. doi: 10.3748/wjg.v24.i39.4499
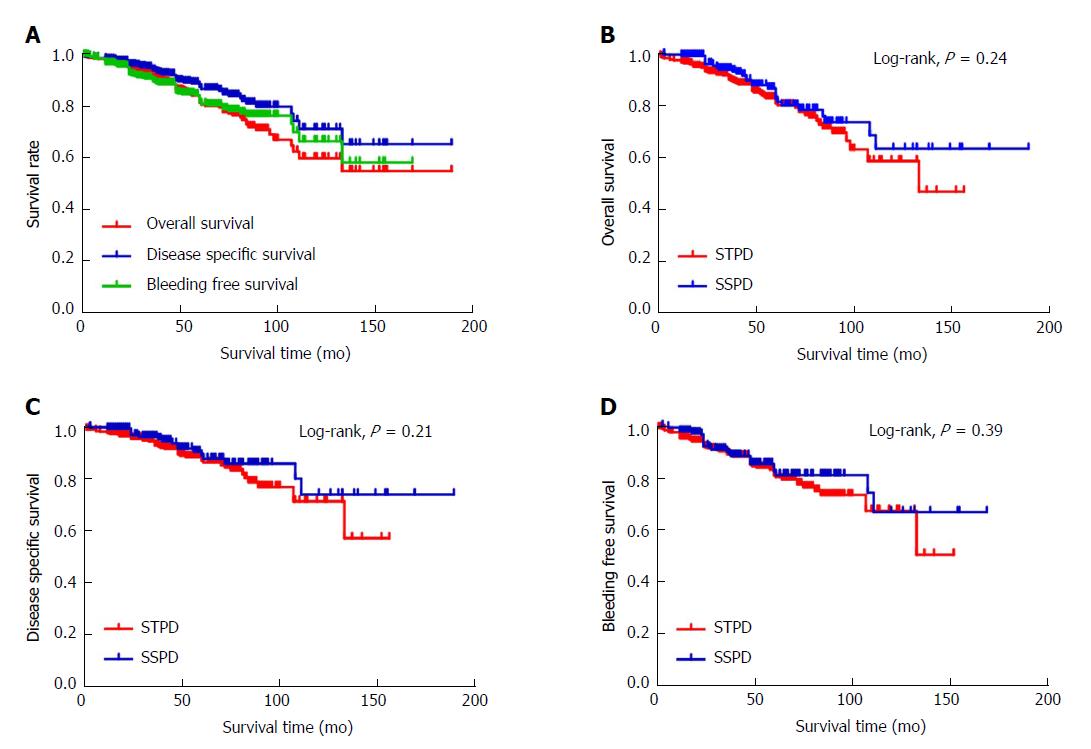
Figure 1 Kaplan-Meier survival curves for overall survival, disease-specific survival and bleeding-free survival.
A: Kaplan-Meier survival curves for OS, DSS and BFS; B: Kaplan-Meier survival curves for OS stratified by the type of operation; C: Kaplan-Meier survival curves for DSS stratified by the type of operation. D: Kaplan-Meier survival curves for BFS stratified by the type of operation. OS: Overall survival; DSS: Disease-specific survival; BFS: Bleeding-free survival.
- Citation: Zhang YF, Ji H, Lu HW, Lu L, Wang L, Wang JL, Li YM. Postoperative survival analysis and prognostic nomogram model for patients with portal hypertension. World J Gastroenterol 2018; 24(39): 4499-4509
- URL: https://www.wjgnet.com/1007-9327/full/v24/i39/4499.htm
- DOI: https://dx.doi.org/10.3748/wjg.v24.i39.4499


