Copyright
©The Author(s) 2018.
World J Gastroenterol. Oct 21, 2018; 24(39): 4448-4461
Published online Oct 21, 2018. doi: 10.3748/wjg.v24.i39.4448
Published online Oct 21, 2018. doi: 10.3748/wjg.v24.i39.4448
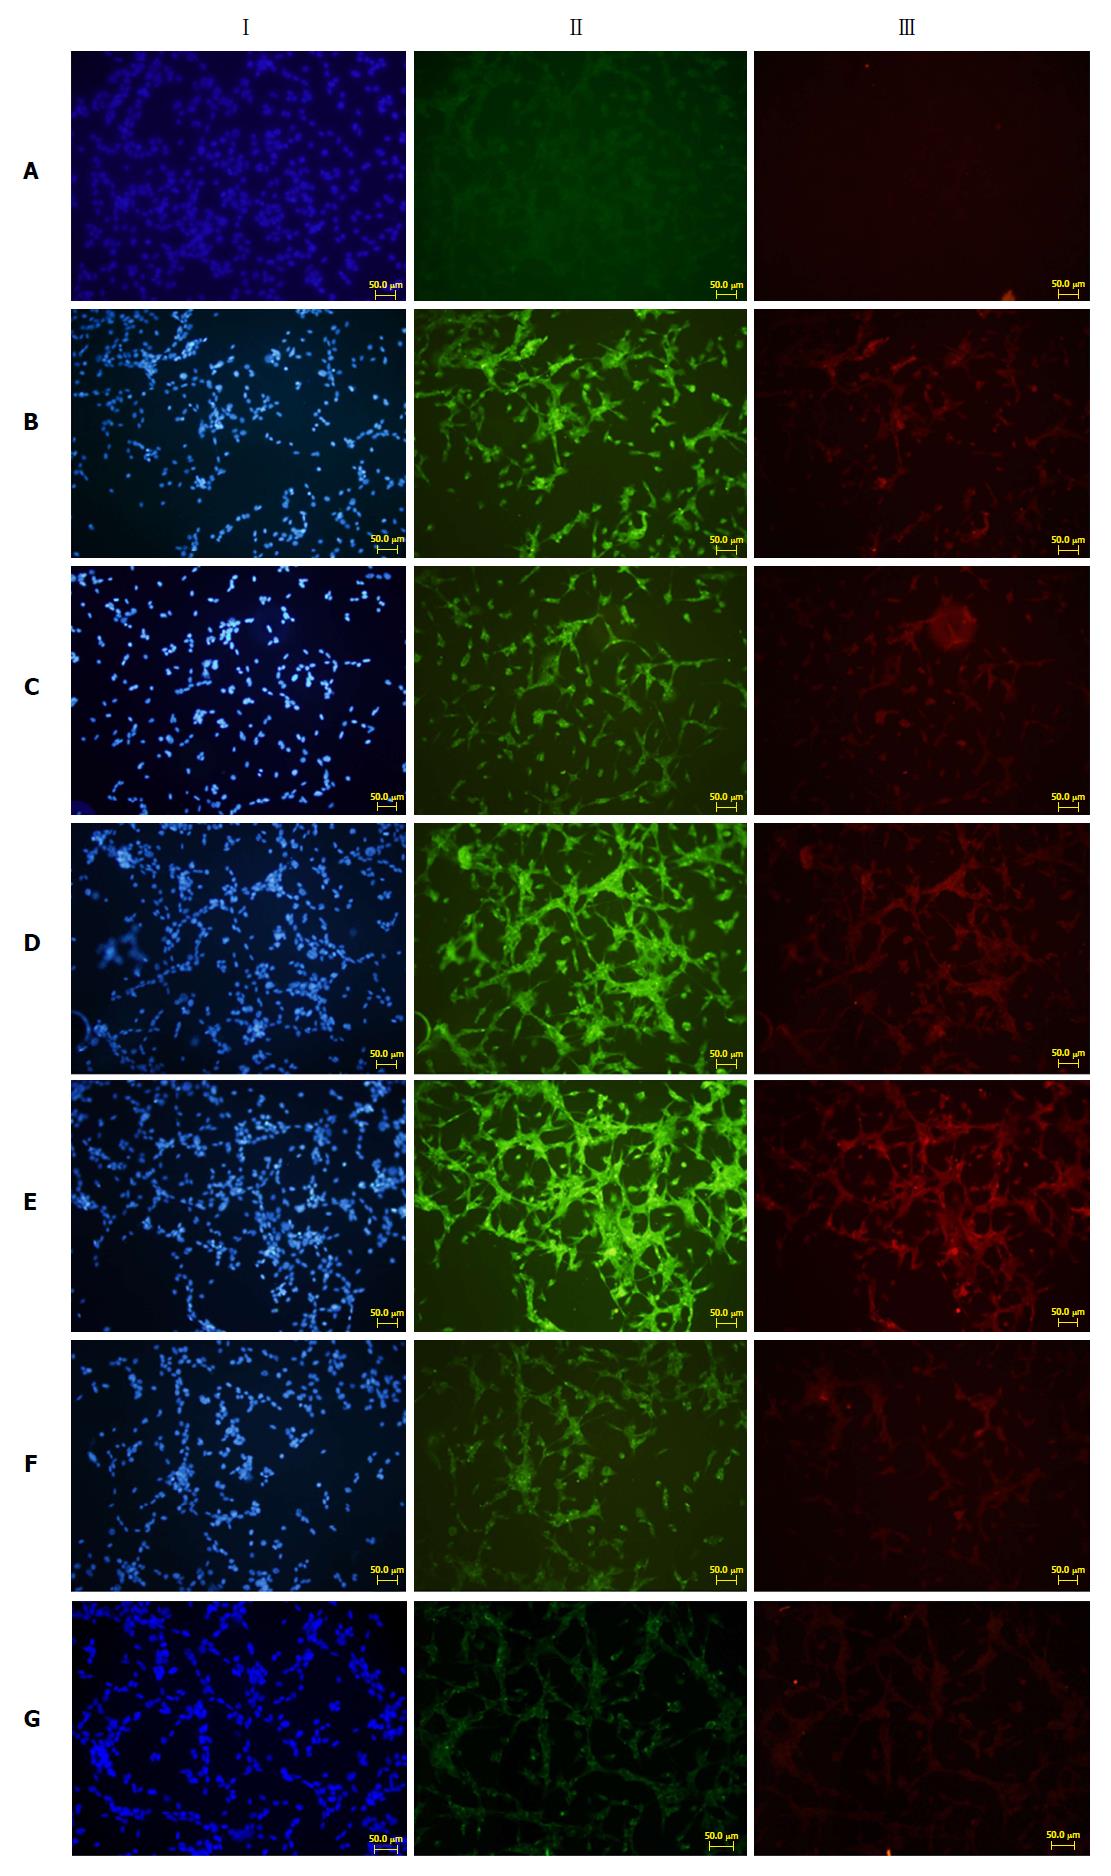
Figure 5 Immunofluorescence results of fibronectin and type I collagenase expression in cells growing on glass coverslips from each group.
I: Nuclear staining of rat pancreatic stellate cells (blue fluorescence); II: Fibronectin staining (green fluorescence); III: Type I collagenase staining (red fluorescence). A: Normal PSC (VLDL-, culture supernatant-); B: PSC stimulated directly with VLDL (VLDL+, culture supernatant-); C: PSC stimulated with normal acinar cell culture supernatants (VLDL-, culture supernatant+); D: PSC stimulated with acinar cell culture supernatant treated with VLDL (VLDL+, culture supernatant+); E: PSC stimulated with acinar cell culture supernatant treated with SJP (VLDL+, culture supernatant+, SJP+); F: PSC stimulated with acinar cell culture supernatant treated with Compound C (VLDL+, culture supernatant+, Compound C+); G: PSC stimulated with acinar cell culture supernatant treated with Compound C and SJP (VLDL+, culture supernatant+, SJP+, Compound C+). PSC: Pancreatic stellate cell; VLDL: Very low-density lipoprotein; SJP: Sheng-jiang powder.
- Citation: Miao YF, Li J, Zhang YM, Zhu L, Chen H, Yuan L, Hu J, Yi XL, Wu QT, Wan MH, Tang WF. Sheng-jiang powder ameliorates obesity-induced pancreatic inflammatory injury via stimulating activation of the AMPK signalling pathway in rats. World J Gastroenterol 2018; 24(39): 4448-4461
- URL: https://www.wjgnet.com/1007-9327/full/v24/i39/4448.htm
- DOI: https://dx.doi.org/10.3748/wjg.v24.i39.4448


