Copyright
©The Author(s) 2018.
World J Gastroenterol. Oct 14, 2018; 24(38): 4356-4368
Published online Oct 14, 2018. doi: 10.3748/wjg.v24.i38.4356
Published online Oct 14, 2018. doi: 10.3748/wjg.v24.i38.4356
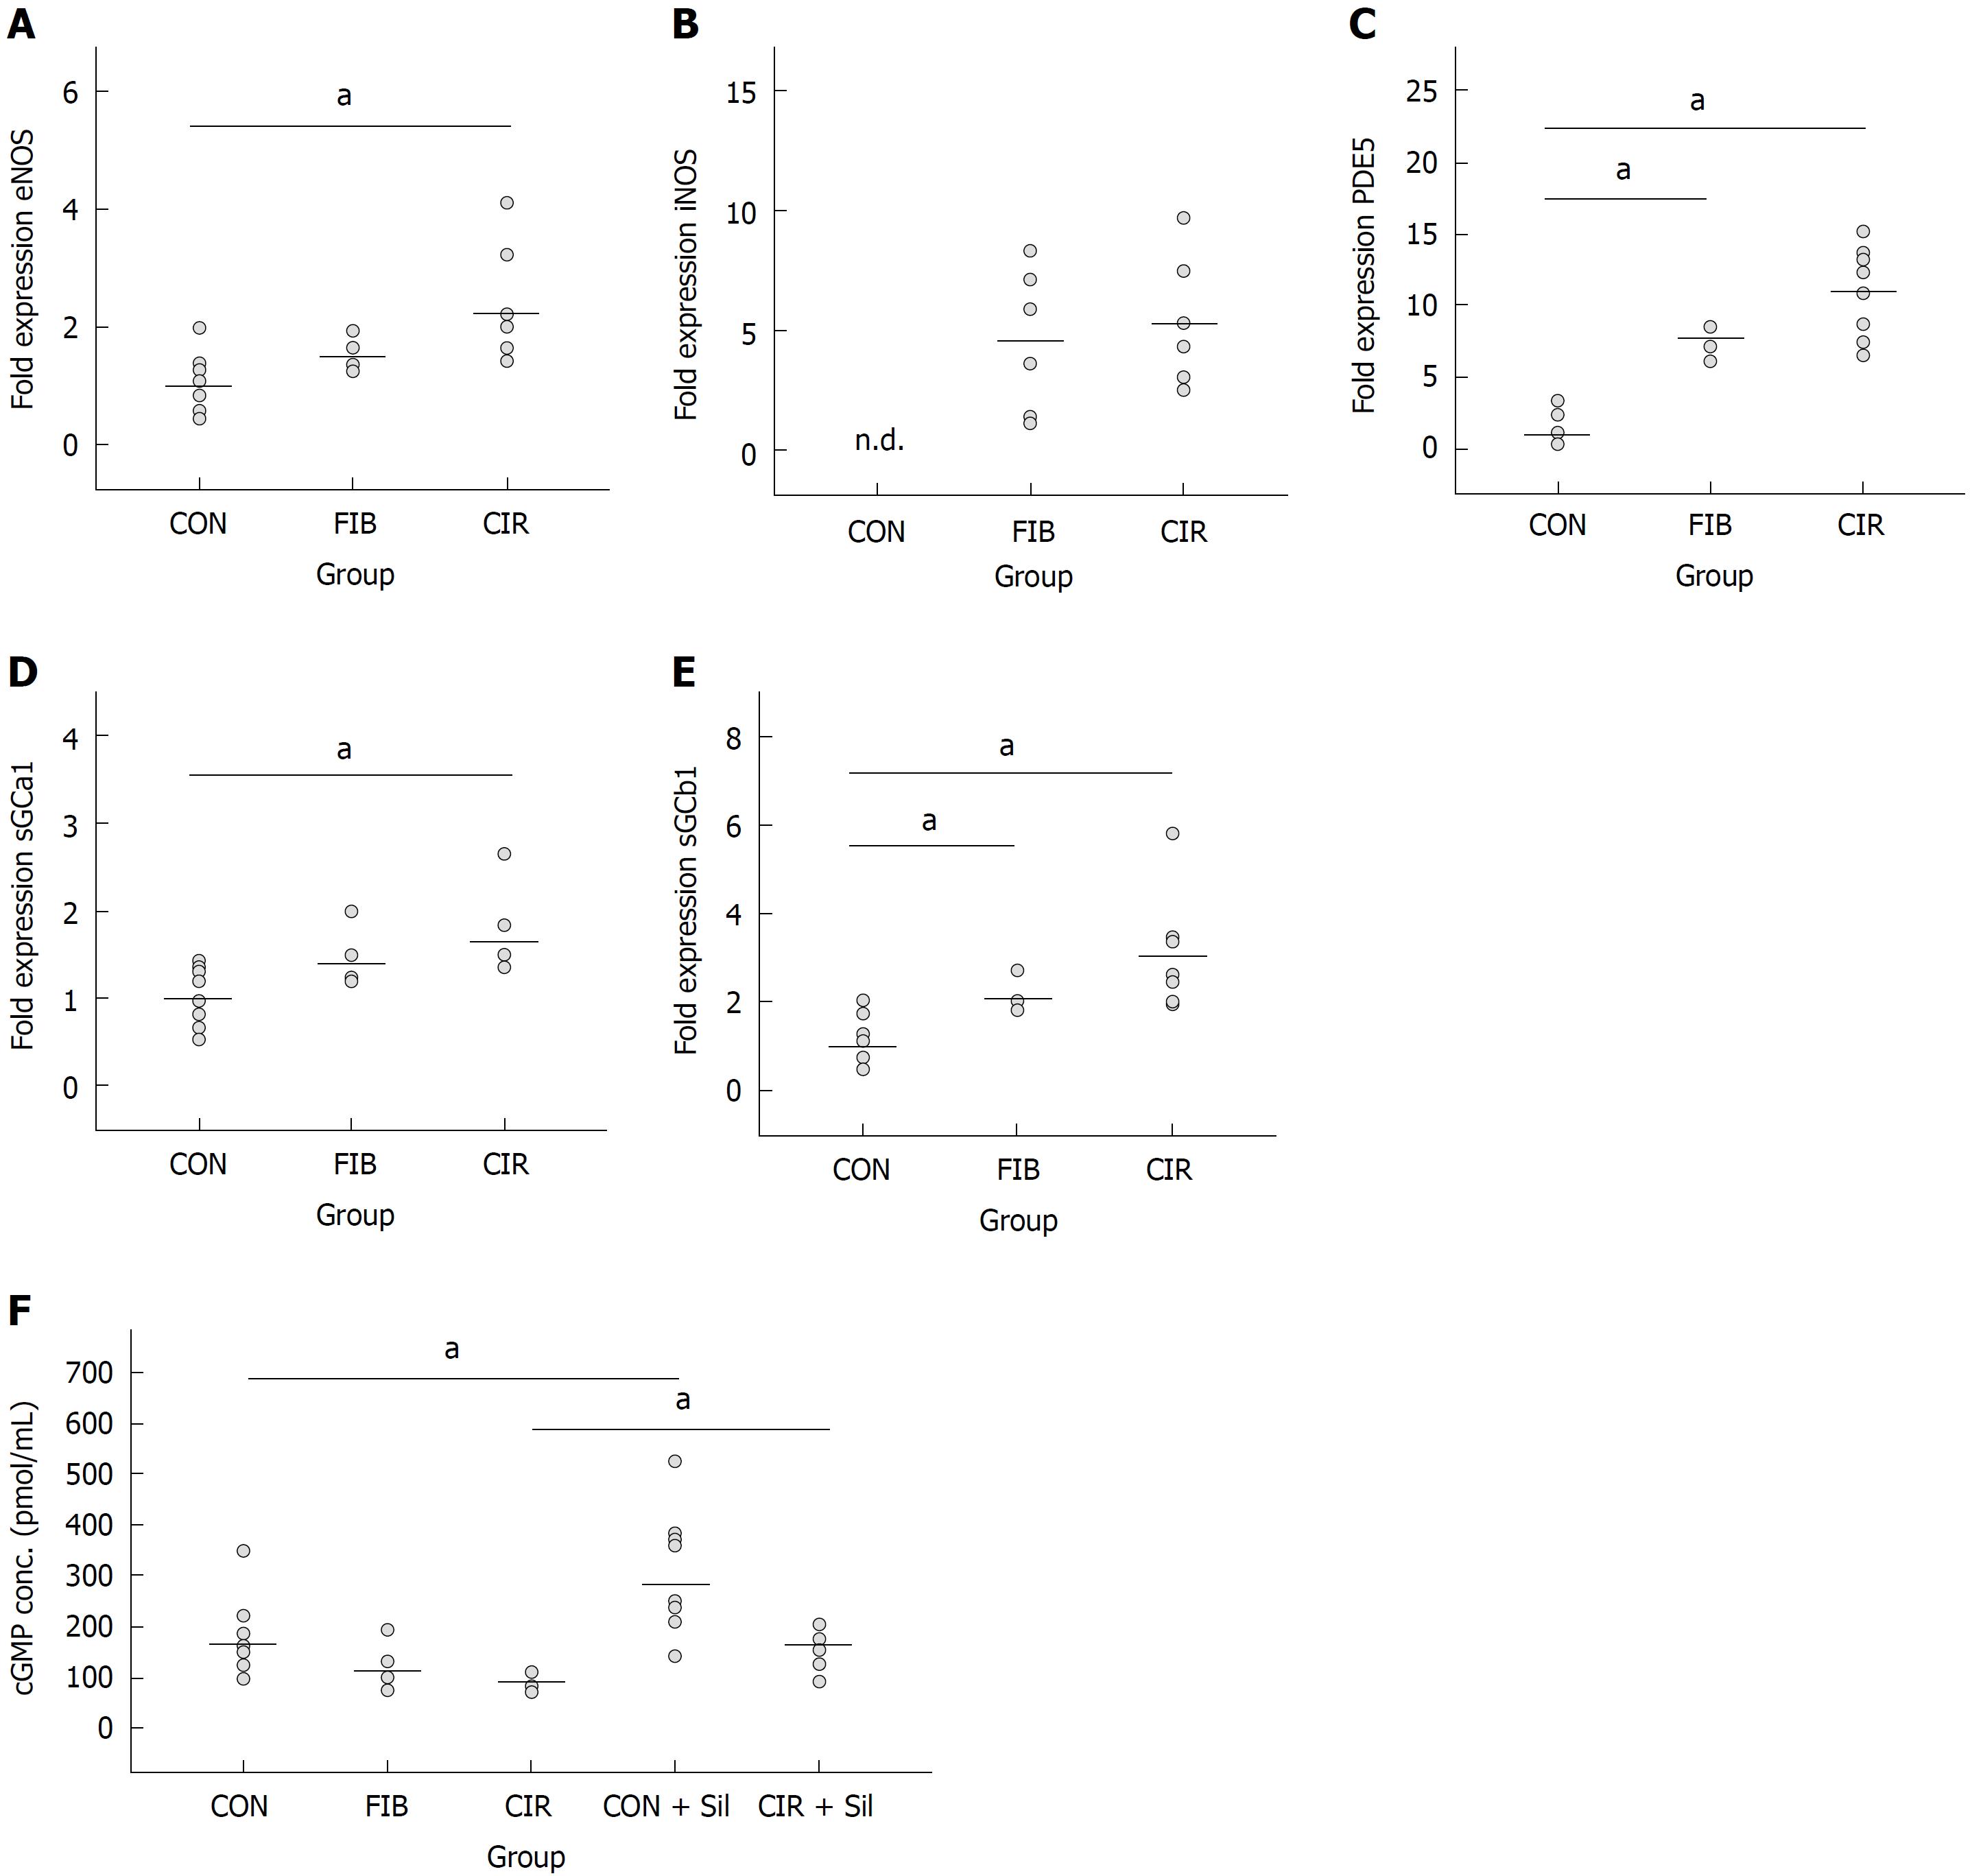
Figure 1 Dotplots showing hepatic gene expression of endothelial NO synthase (A), inducible NO synthase (B), phosphodiesterase-5 (C), soluble guanylate cyclase subunits α1 (D) and soluble guanylate cyclase subunits β1 (E), and serum cyclic guanosine monophosphate concentrations (pmol/mL) (F).
Significant differences among groups are corrected for multiple comparisons and denoted by aP < 0.05. Gene expression levels are given as fold expression compared to CON. Since iNOS expression in CON was below the detection limit, it was arbitrarily set to “1.0”. iNOS: Inducible NO synthase.
- Citation: Schaffner D, Lazaro A, Deibert P, Hasselblatt P, Stoll P, Fauth L, Baumstark MW, Merfort I, Schmitt-Graeff A, Kreisel W. Analysis of the nitric oxide-cyclic guanosine monophosphate pathway in experimental liver cirrhosis suggests phosphodiesterase-5 as potential target to treat portal hypertension. World J Gastroenterol 2018; 24(38): 4356-4368
- URL: https://www.wjgnet.com/1007-9327/full/v24/i38/4356.htm
- DOI: https://dx.doi.org/10.3748/wjg.v24.i38.4356


