Copyright
©The Author(s) 2018.
World J Gastroenterol. Oct 14, 2018; 24(38): 4341-4355
Published online Oct 14, 2018. doi: 10.3748/wjg.v24.i38.4341
Published online Oct 14, 2018. doi: 10.3748/wjg.v24.i38.4341
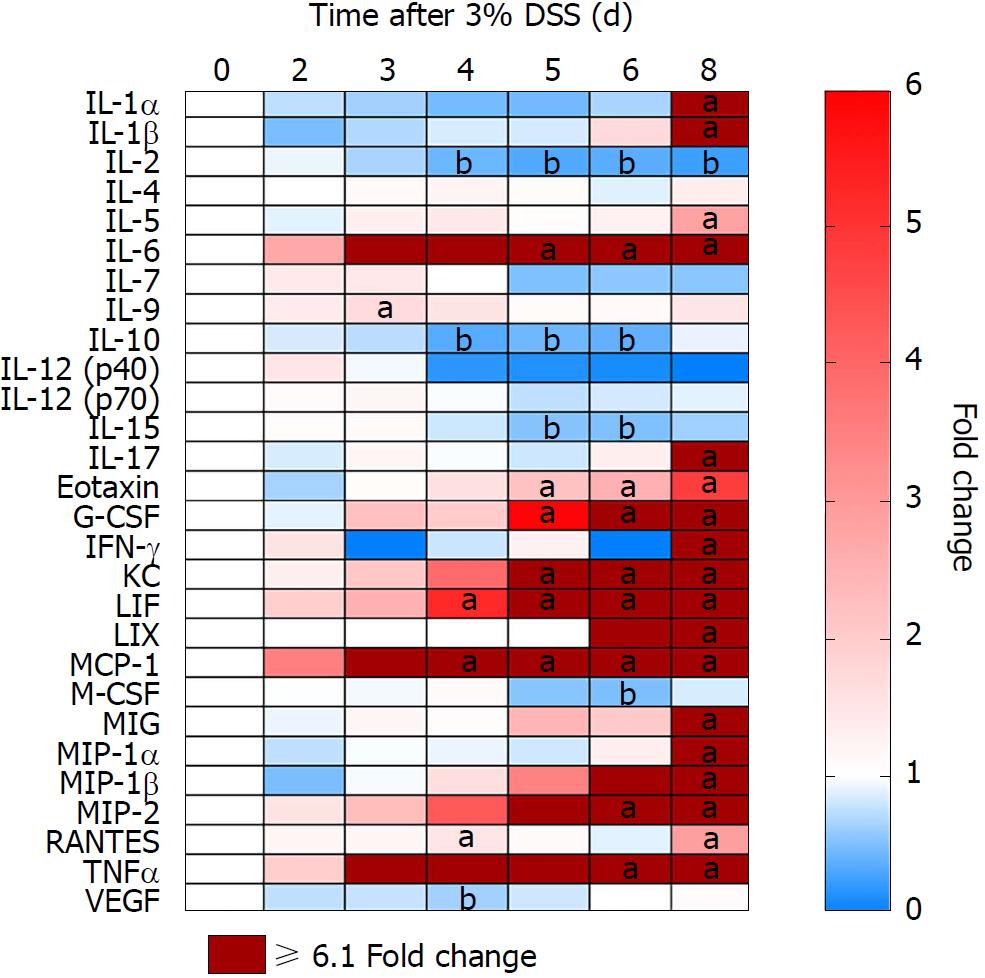
Figure 4 Colonic proteomic analysis from 3% dextran sulfate sodium time course.
After induction of ulcerative colitis with 3% DSS, colon samples were collected at different time points from day 0 to 8. Proteomics was analyzed through multiplex ELISA assay and revealed four patterns: (pattern A) Progressive decreased expression of IL-2, IL-10 and IL-15 around day 4; (pattern B) Progressive increased expression IL-6, Eotaxin, G-CSF, KC, LIF, MCP-1, MIP-2 and TNFα around day 4; (pattern C) Increased expression of CCTF after stopping 3% DSS (i.e., day 8) of IL-1α, IL1β, IL-5, IL-17, IFN-γ, LIX, MIG, MIP-1α MIP-1β, and RANTES; and (pattern D) Little or no change in IL-4, IL-7, IL-9, IL-12(p40), IL-12(p70), M-CSF and VEGF. One-way ANOVA followed by Dunnett post-hoc test. aP < 0.05 fold increases compared to control (day 0). bP < 0.05 fold decreases compared to control (day 0). n = 5-6/each time point. DSS: Dextran sulfate sodium; G-CSF: Granulocyte-colony stimulating factor; KC: Keratinocyte chemoattractant; LIF: Leukemia inhibitory factor; MCP-1: Monocyte chemoattractant protein 1; TNFα: Tumor necrosis factor alpha; IFN-γ: Interferon γ; LIX: Lipopolysaccharide-induced CXC chemokine; MIP-1α: Macrophage inflammatory protein 1α; RANTES : Regulated on activation, normal T cell expressed and secreted.
- Citation: Nunes NS, Kim S, Sundby M, Chandran P, Burks SR, Paz AH, Frank JA. Temporal clinical, proteomic, histological and cellular immune responses of dextran sulfate sodium-induced acute colitis. World J Gastroenterol 2018; 24(38): 4341-4355
- URL: https://www.wjgnet.com/1007-9327/full/v24/i38/4341.htm
- DOI: https://dx.doi.org/10.3748/wjg.v24.i38.4341


