Copyright
©The Author(s) 2018.
World J Gastroenterol. Sep 28, 2018; 24(36): 4197-4207
Published online Sep 28, 2018. doi: 10.3748/wjg.v24.i36.4197
Published online Sep 28, 2018. doi: 10.3748/wjg.v24.i36.4197
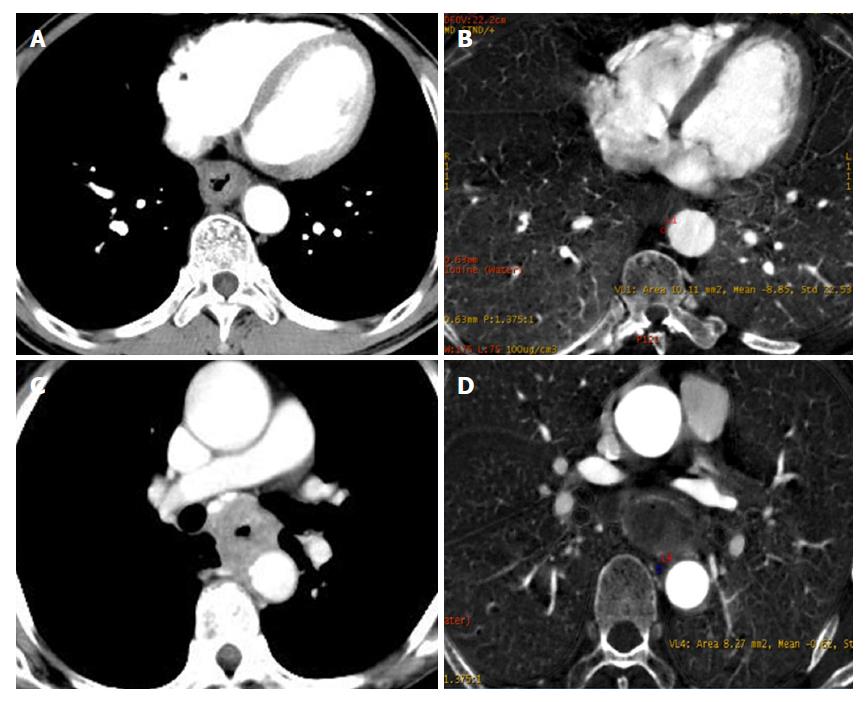
Figure 6 Typical cases showing differences between the T3 and T4 stages of esophageal squamous cell carcinoma.
A: Image from a 62-year old patient with T3N0M0 obtained using EICT combined GSI assist shows a clear triangular area in front of the vertebral body. B: IC in the triangle area during the AP was quantified to be -8.85 μg/cm3, and NIC during the AP was -0.05 μg/cm3. C: An axial image of a 57-year old patient obtained by EICT combined with GSI assist during the AP shows that the adipose tissue of the triangular area disappeared with suspected tumor invasion. D: IC in the triangle area during the AP was quantified to be -0.62 μg/cm3, and NIC during the AP was -0.01 μg/cm3. EICT: Esophageal insufflation computed tomography; IC: Iodine concentration; NIC: Normalized iodine concentration; AP: Arterial phase.
- Citation: Zhou Y, Liu D, Hou P, Zha KJ, Wang F, Zhou K, He W, Gao JB. Low-dose spectral insufflation computed tomography protocol preoperatively optimized for T stage esophageal cancer - preliminary research experience. World J Gastroenterol 2018; 24(36): 4197-4207
- URL: https://www.wjgnet.com/1007-9327/full/v24/i36/4197.htm
- DOI: https://dx.doi.org/10.3748/wjg.v24.i36.4197


