Copyright
©The Author(s) 2018.
World J Gastroenterol. Sep 28, 2018; 24(36): 4178-4185
Published online Sep 28, 2018. doi: 10.3748/wjg.v24.i36.4178
Published online Sep 28, 2018. doi: 10.3748/wjg.v24.i36.4178
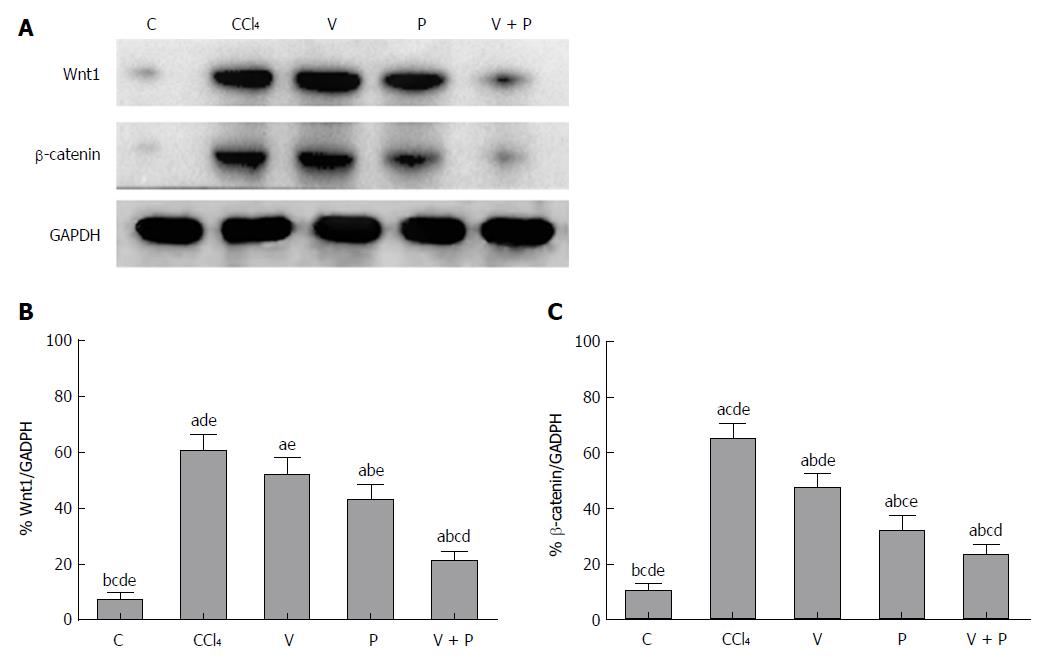
Figure 3 The protein levels of Wnt1 and β-catenin of liver tissues in rats in the CCl4 group and the medicated groups were higher than the Control (C) group.
A: Detection of protein levels of Wnt1, and β-catenin using western blot assay; B: Grey analysis of Wnt1; C: Grey analysis of β-catenin [in the comparison of mean ± standard deviation (SD) of various groups, differences are statistically significant when P < 0.05, n = 10. In addition, a, b, c, d, and e represent statistical differences vs C, CCl4, V, P, and V + P groups, respectively]. C: Control; V: Vitamin; P: Puerarin.
- Citation: Huang GR, Wei SJ, Huang YQ, Xing W, Wang LY, Liang LL. Mechanism of combined use of vitamin D and puerarin in anti-hepatic fibrosis by regulating the Wnt/β-catenin signalling pathway. World J Gastroenterol 2018; 24(36): 4178-4185
- URL: https://www.wjgnet.com/1007-9327/full/v24/i36/4178.htm
- DOI: https://dx.doi.org/10.3748/wjg.v24.i36.4178


