Copyright
©The Author(s) 2018.
World J Gastroenterol. Sep 14, 2018; 24(34): 3871-3883
Published online Sep 14, 2018. doi: 10.3748/wjg.v24.i34.3871
Published online Sep 14, 2018. doi: 10.3748/wjg.v24.i34.3871
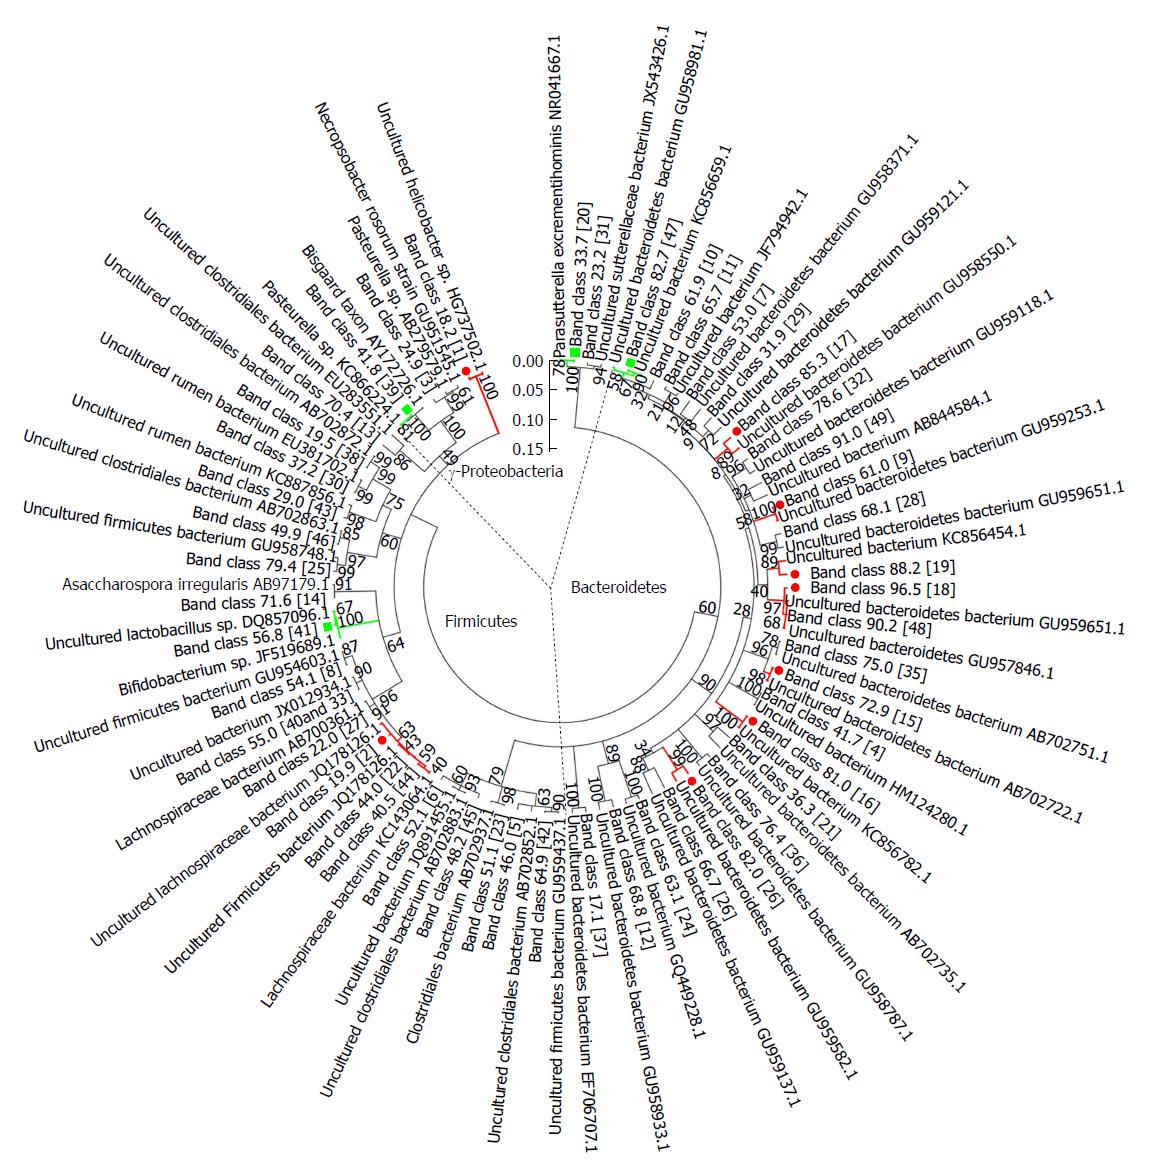
Figure 6 Phylogenetic tree analysis of sequences in the denaturing gradient gel electrophoresis profiles.
Phylogenetic tree analysis of sequences from denaturing gradient gel electrophoresis (DGGE) profiles using the neighbor-joining method was conducted using MEGA 5 software. Almost all matched bacteria of the 48 DGGE band classes were assigned to three phyla: Bacteroidetes (50.0%), Firmicutes (39.6%), and Gammaproteobacteria (10.4%). The fragment sequences were defined according to their positions in gels using the band-matching tool with BioNumerics software version 6.01 (Applied Maths). The numbers in the brackets were consistent with the numbers shown in DGGE profiling. Nine band classes (labeled with a red dot) were decreased and four band classes (labeled with the green square) were higher in the FK506-M group than the rejection group. The plot was obtained using MEGA5 software (http://en.wikipedia.org/wiki/MEGA,_Molecular_Evolutionary_Genetics_Analysis).
- Citation: Jiang JW, Ren ZG, Lu HF, Zhang H, Li A, Cui GY, Jia JJ, Xie HY, Chen XH, He Y, Jiang L, Li LJ. Optimal immunosuppressor induces stable gut microbiota after liver transplantation. World J Gastroenterol 2018; 24(34): 3871-3883
- URL: https://www.wjgnet.com/1007-9327/full/v24/i34/3871.htm
- DOI: https://dx.doi.org/10.3748/wjg.v24.i34.3871


