Copyright
©The Author(s) 2018.
World J Gastroenterol. Sep 14, 2018; 24(34): 3871-3883
Published online Sep 14, 2018. doi: 10.3748/wjg.v24.i34.3871
Published online Sep 14, 2018. doi: 10.3748/wjg.v24.i34.3871
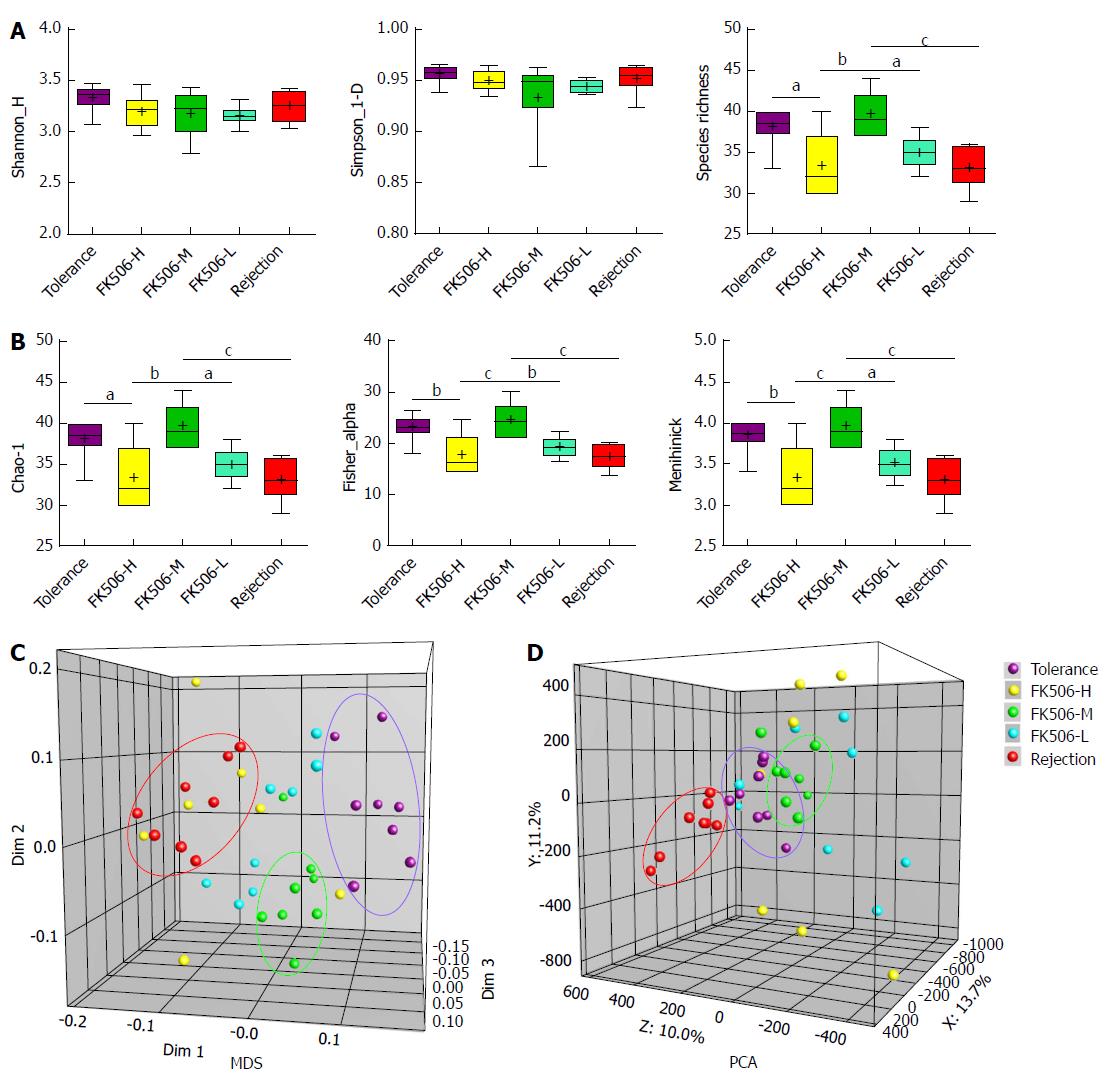
Figure 4 Diversity analysis and cluster analysis of denaturing gradient gel electrophoresis profiles based on Dice’s coefficient and the unweighted pair-group method with arithmetic means method.
A: Based on amount of gray area of each band of each lane in the denaturing gradient gel electrophoresis (DGGE) profiles quantified using the Gel-Pro analyzer, the gut microbial diversity and species richness were assessed with the Shannon index and Simpson index in the different groups; B: The abundance and distribution of the rare species were estimated using the Chao-1 index, Fisher alpha index, and Menhinick index in the different groups; C: Multidimensional scaling (MDS) analysis of each sample of the DGGE profiles. The plot is an optimized three-dimensional representation of the similarity matrix obtained from BioNumerics software. The Euclidean distance between the two points reflects similarity; D: Principal components analysis (PCA) of fecal microbiota based on DGGE fingerprinting. The plot is orientated to maximize the variation among lanes along the first three principal components (with contributions of 13.7, 11.2 and 10.0, respectively) obtained from BioNumerics software. aP < 0.05; bP < 0.01; cP < 0.001.
- Citation: Jiang JW, Ren ZG, Lu HF, Zhang H, Li A, Cui GY, Jia JJ, Xie HY, Chen XH, He Y, Jiang L, Li LJ. Optimal immunosuppressor induces stable gut microbiota after liver transplantation. World J Gastroenterol 2018; 24(34): 3871-3883
- URL: https://www.wjgnet.com/1007-9327/full/v24/i34/3871.htm
- DOI: https://dx.doi.org/10.3748/wjg.v24.i34.3871


