Copyright
©The Author(s) 2018.
World J Gastroenterol. Sep 14, 2018; 24(34): 3849-3860
Published online Sep 14, 2018. doi: 10.3748/wjg.v24.i34.3849
Published online Sep 14, 2018. doi: 10.3748/wjg.v24.i34.3849
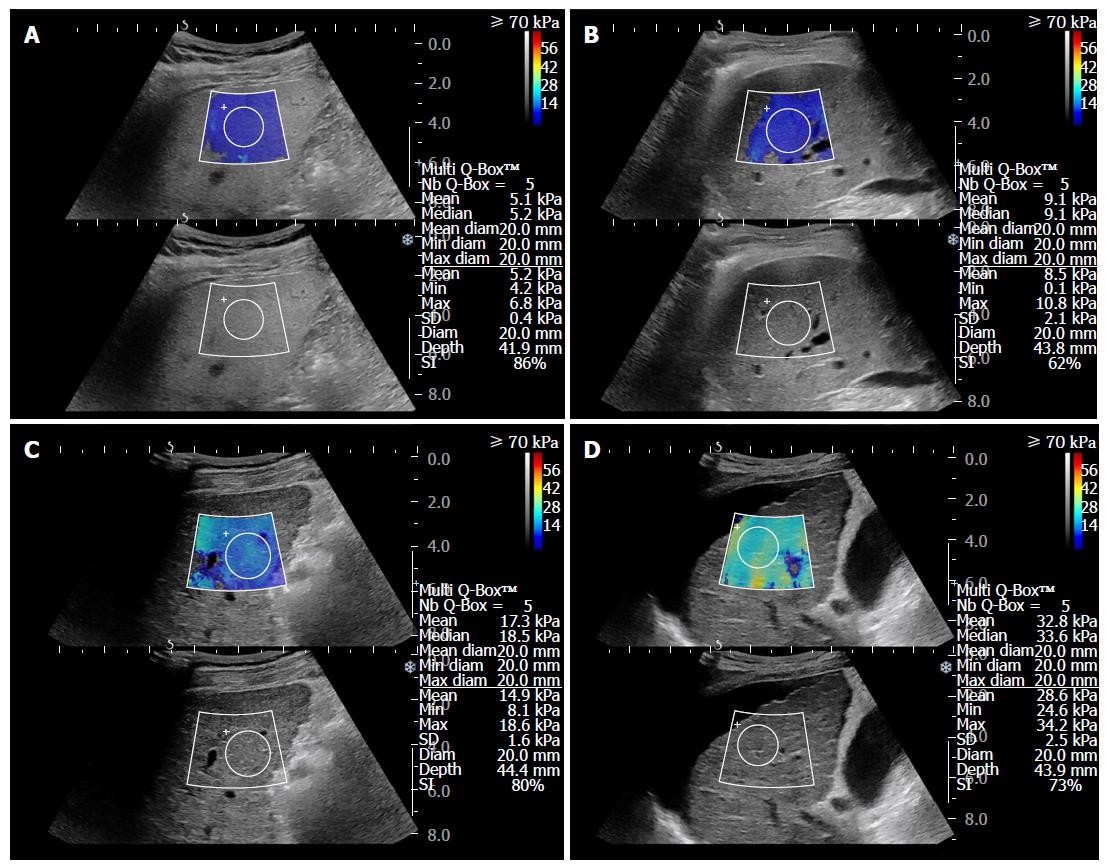
Figure 1 Liver two-dimensional shear wave elastography images.
A. 2D-SWE images of a 52-year-old patient without underlying disease with normal range of LS. Ultrasound images show the color-code mapping of 2D-SWE (top) and the corresponding B-mode image (bottom). On the right side of the image, the mean (5.2 kPa) and standard deviation (0.4 kPa) of Young modulus in the ROI have been calculated. And the size and depth of the measured ROI are recorded. The summarized values at the top are the mean and median values of the stiffness values of the previous 4 measurements and the 5th measurement, and the average sizes of the measured ROI. B. A 2D-SWE image of a 58-year-old patient with chronic hepatitis B who was proven as F2 fibrosis in liver biopsy specimen. Increased LS (8.5 kPa) was identified compared to normal patients. C. In 55-year-old patient with chronic hepatitis B and compensated cirrhosis, median LS was 18.5 kPa. D. In 71-year-old patient with chronic hepatitis B and decompensated cirrhosis with ascites, median LS was 33.6 kPa. 2D-SWE: Two-dimensional shear wave elastography; LS: Liver stiffness; ROI: Region of interest.
- Citation: Jeong JY, Cho YS, Sohn JH. Role of two-dimensional shear wave elastography in chronic liver diseases: A narrative review. World J Gastroenterol 2018; 24(34): 3849-3860
- URL: https://www.wjgnet.com/1007-9327/full/v24/i34/3849.htm
- DOI: https://dx.doi.org/10.3748/wjg.v24.i34.3849


