Copyright
©The Author(s) 2018.
World J Gastroenterol. Aug 14, 2018; 24(30): 3448-3461
Published online Aug 14, 2018. doi: 10.3748/wjg.v24.i30.3448
Published online Aug 14, 2018. doi: 10.3748/wjg.v24.i30.3448
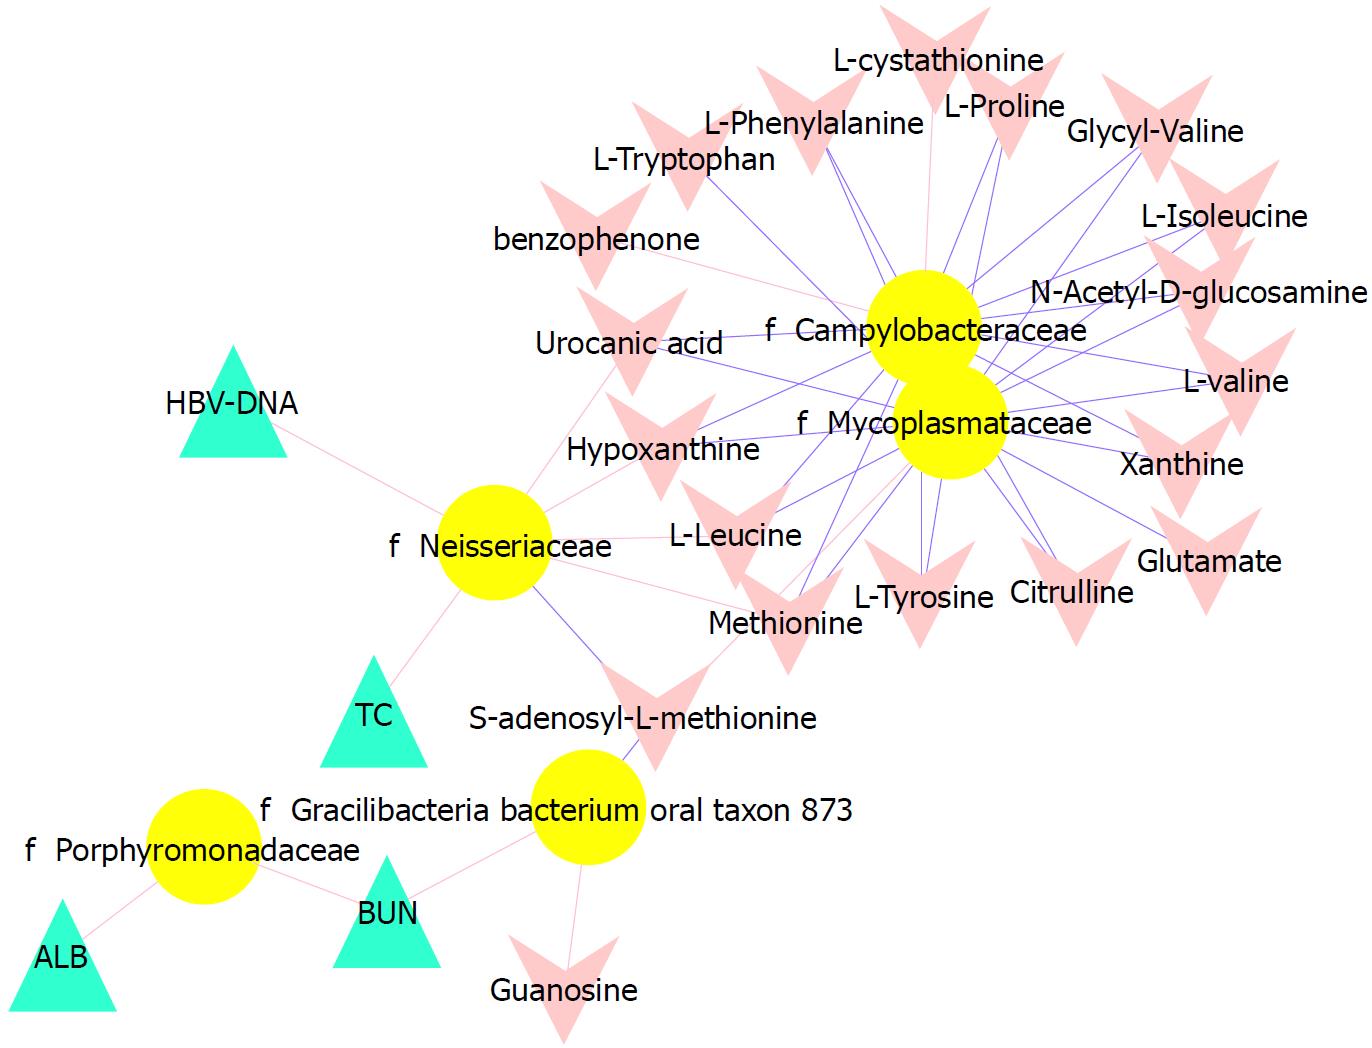
Figure 5 Associations of the tongue coating microbiotas with metabolites and clinical indices.
Correlations were detected, and the indices with Spearman’s correlation coefficients > 0.3 were visualized in Cytoscape. Triangles represent clinical indicators, arrows represent metabolites and dots represent oral microbial families. If the correlations are negative, the connecting line is blue; if the correlation is positive, the connecting line is red. The line thickness represents the size of the correlation coefficient.
- Citation: Zhao Y, Mao YF, Tang YS, Ni MZ, Liu QH, Wang Y, Feng Q, Peng JH, Hu YY. Altered oral microbiota in chronic hepatitis B patients with different tongue coatings. World J Gastroenterol 2018; 24(30): 3448-3461
- URL: https://www.wjgnet.com/1007-9327/full/v24/i30/3448.htm
- DOI: https://dx.doi.org/10.3748/wjg.v24.i30.3448


