Copyright
©The Author(s) 2018.
World J Gastroenterol. Aug 14, 2018; 24(30): 3398-3413
Published online Aug 14, 2018. doi: 10.3748/wjg.v24.i30.3398
Published online Aug 14, 2018. doi: 10.3748/wjg.v24.i30.3398
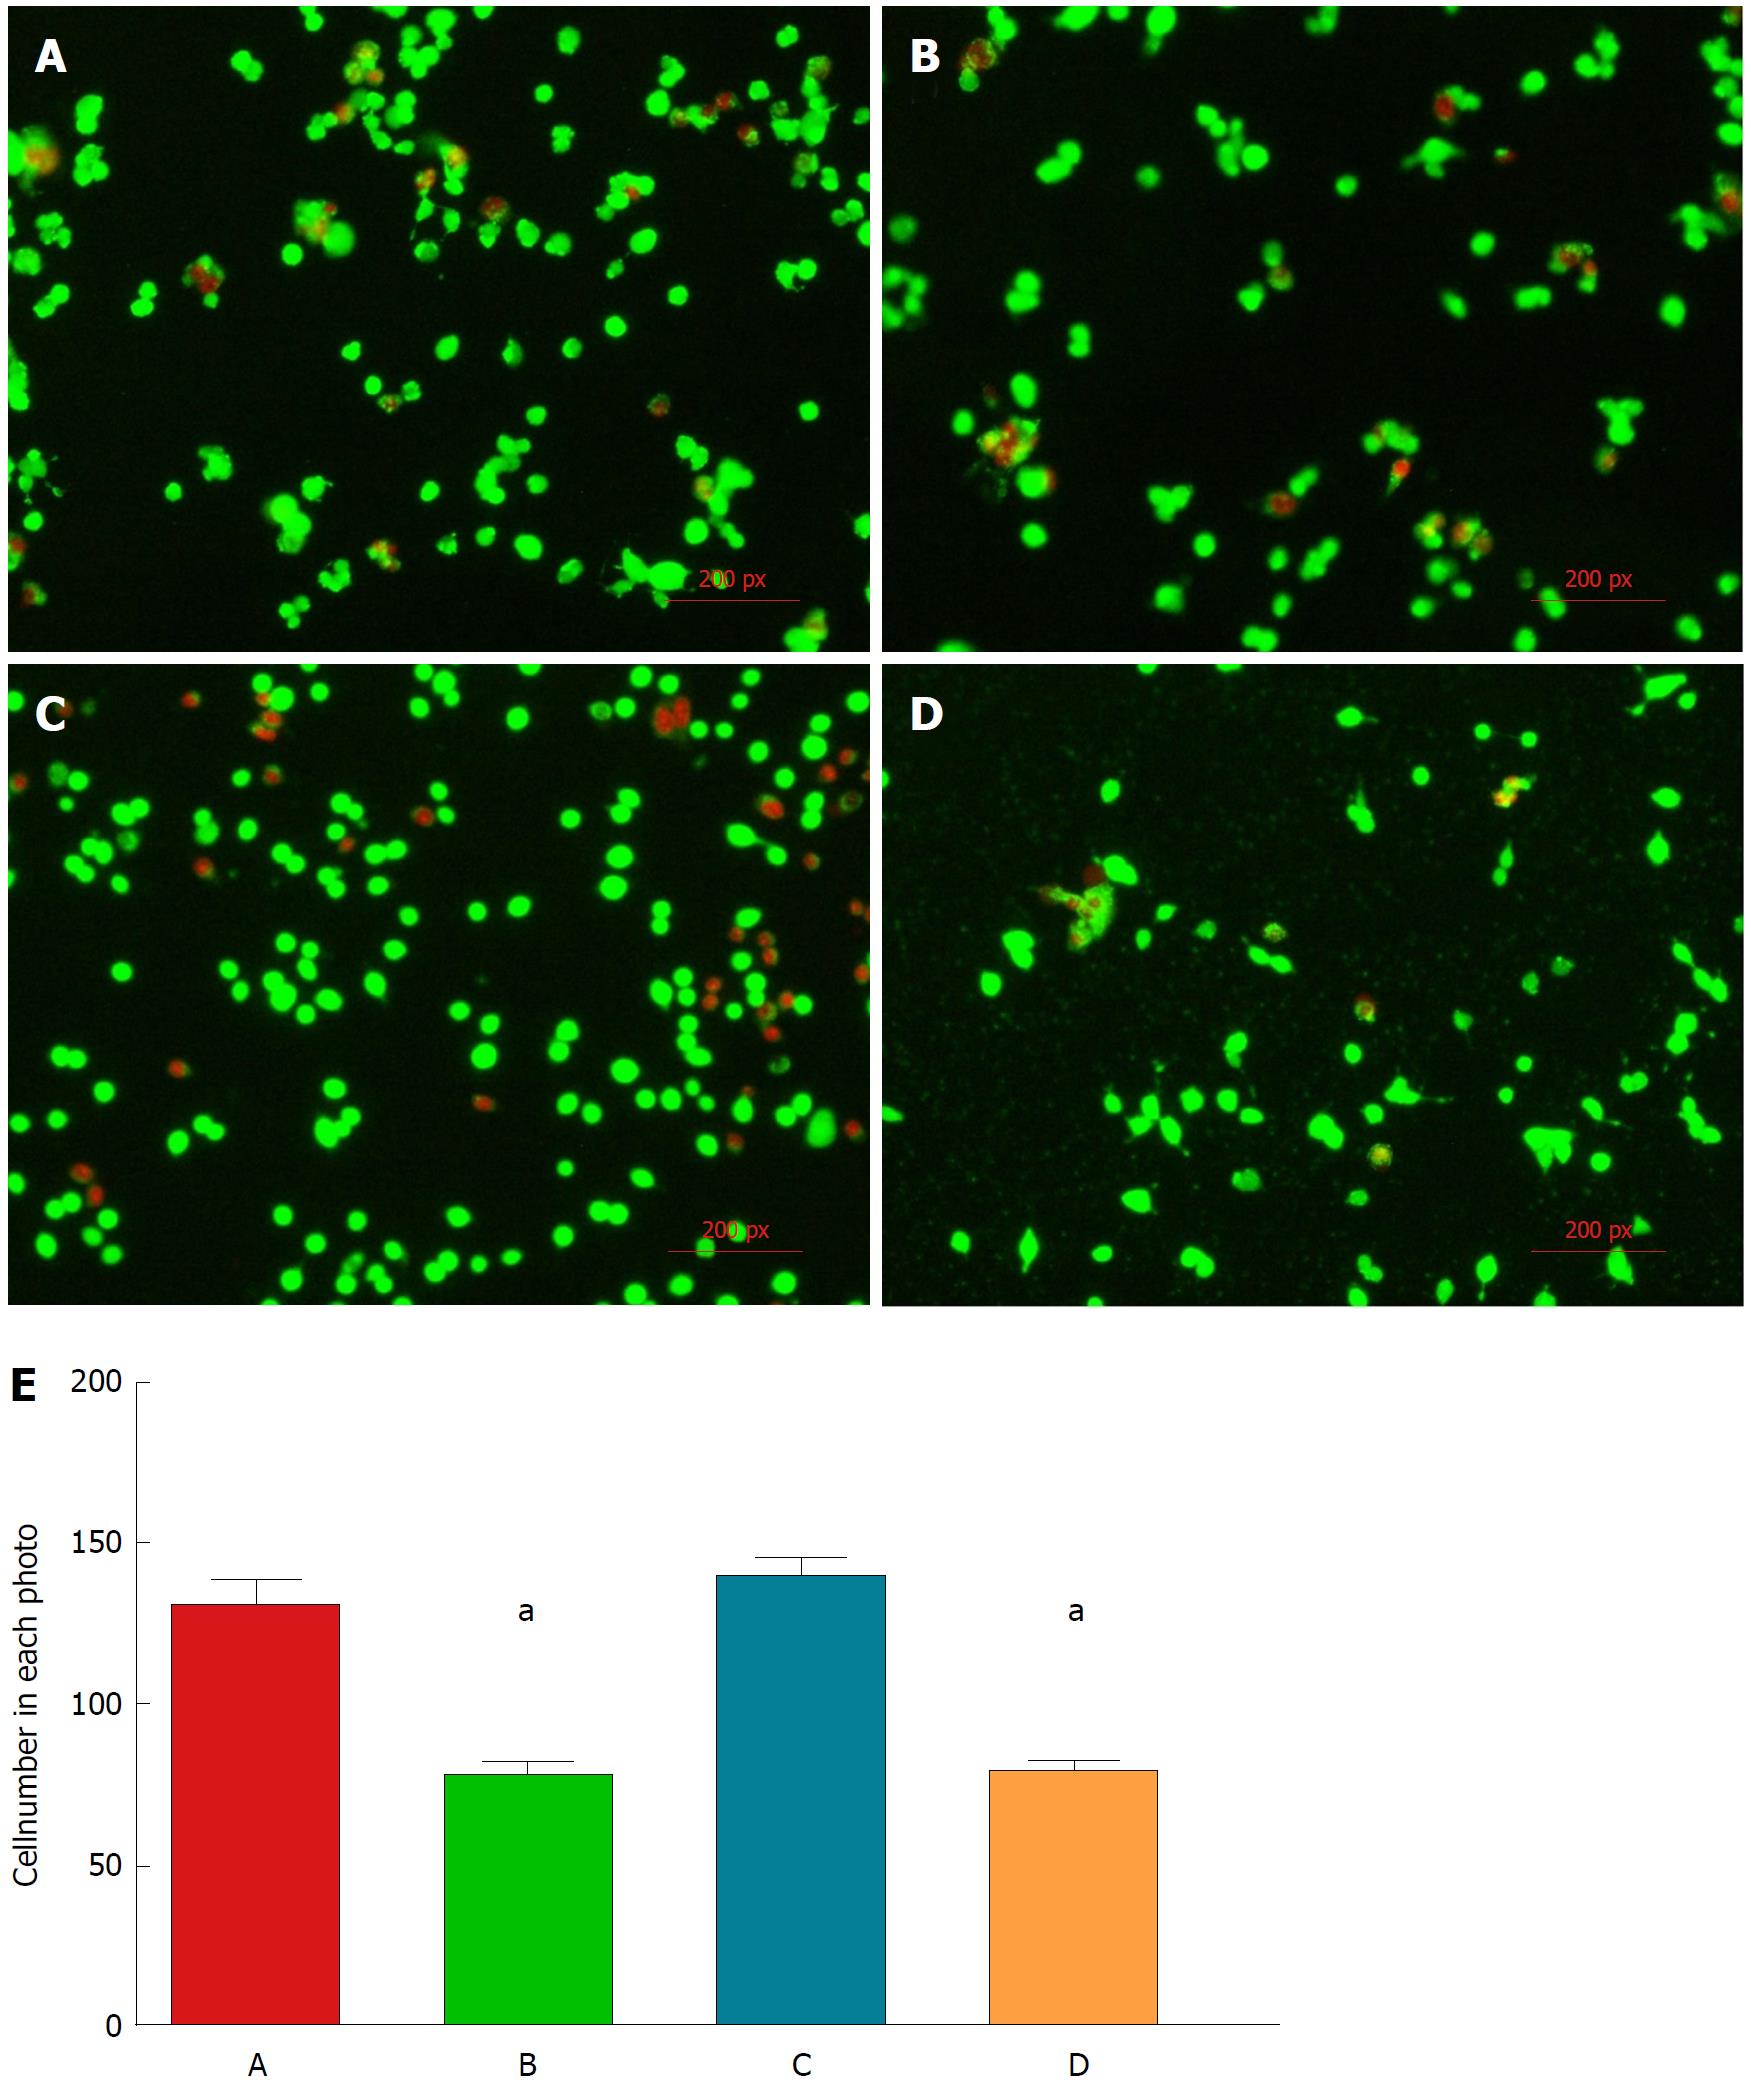
Figure 1 Fluorescence microscopy assessment of live (green-labeled) and dead (red-labeled) C3A cells at 24 h post-seeding in each group.
A: Serum-free medium; B: HepatoZYME; C: DMEM/F12 with 100 mL/L FBS; D: DMEM/F12; and E: comparison of cell number from photos in each group: (group A) serum-free medium, (group B) HepatoZYME, (group C) DMEM/F12 with 100 mL/L FBS, and (group D) DMEM/F12. Data are expressed as mean ± SD (n = 3). aP < 0.05. FBS: Fetal bovine serum.
- Citation: Huang Y, Peng Q, Li HY, Jia ZD, Li Y, Gao Y. Novel sericin-based hepatocyte serum-free medium and sericin’s effect on hepatocyte transcriptome. World J Gastroenterol 2018; 24(30): 3398-3413
- URL: https://www.wjgnet.com/1007-9327/full/v24/i30/3398.htm
- DOI: https://dx.doi.org/10.3748/wjg.v24.i30.3398


