Copyright
©The Author(s) 2018.
World J Gastroenterol. Aug 14, 2018; 24(30): 3361-3373
Published online Aug 14, 2018. doi: 10.3748/wjg.v24.i30.3361
Published online Aug 14, 2018. doi: 10.3748/wjg.v24.i30.3361
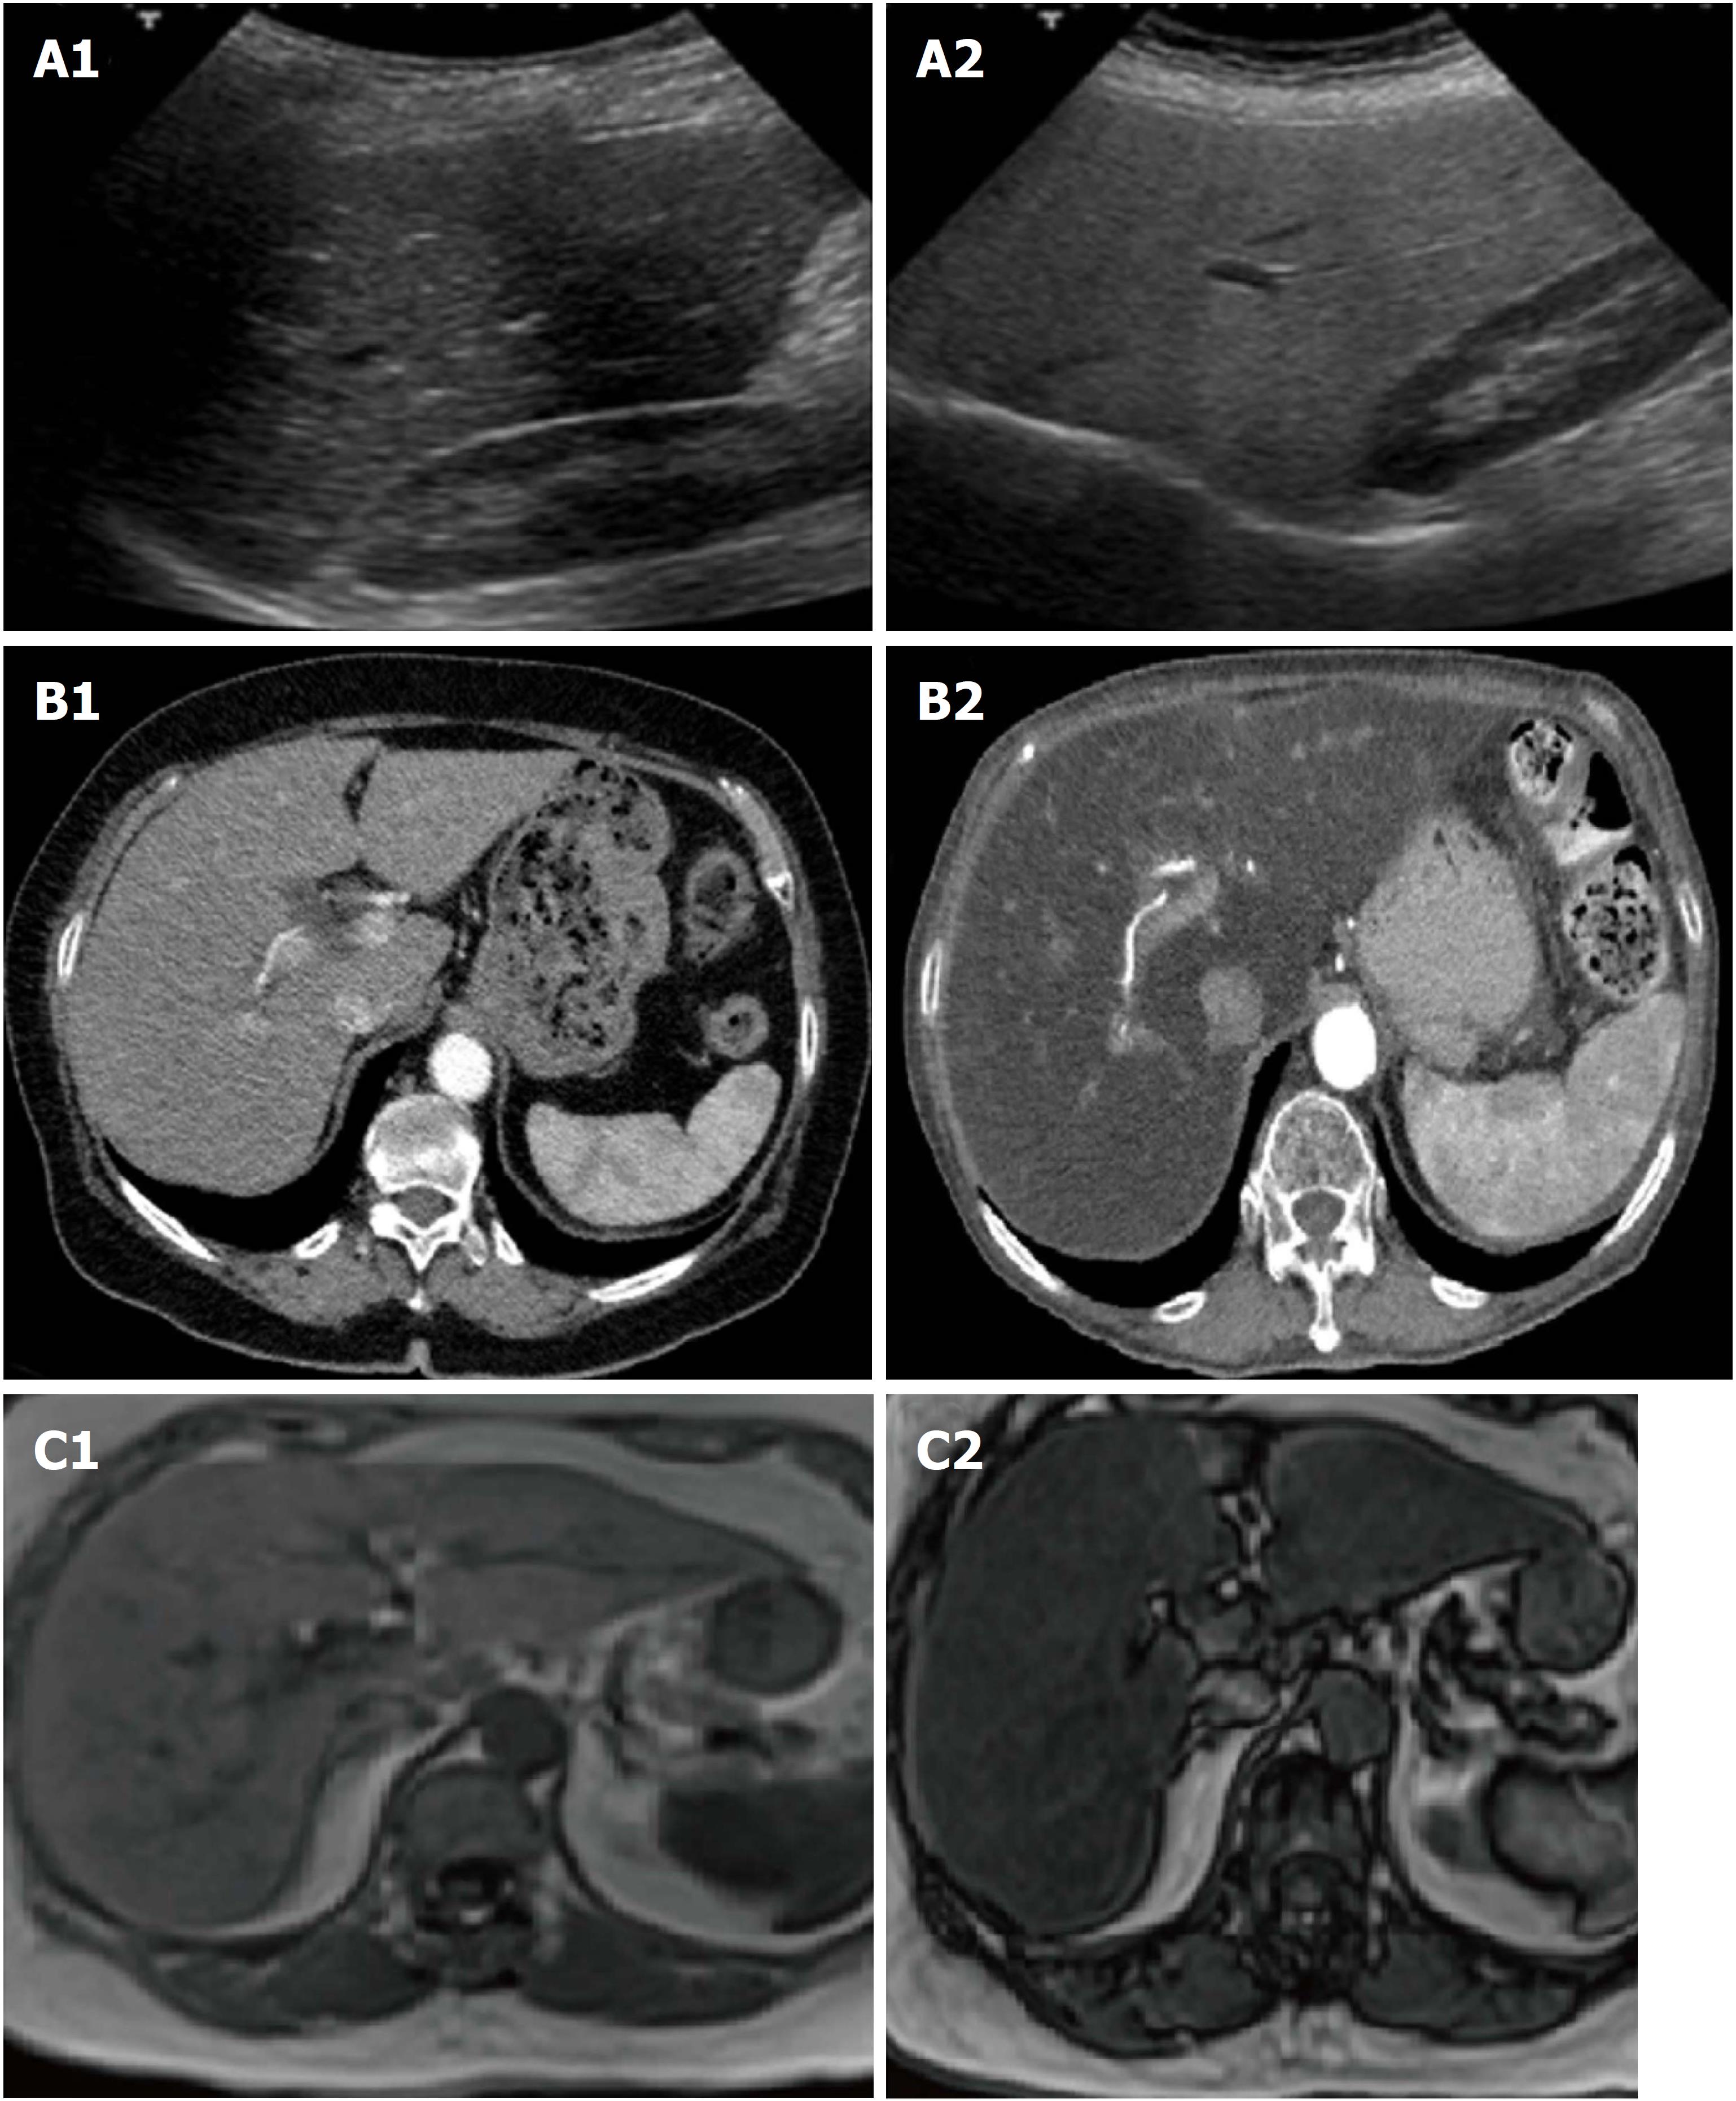
Figure 2 Aspects of liver steatosis according to the different imaging techniques.
In normal ultrasound examination liver parenchyma is isoechoic to the renal parenchyma in normal conditions (A1), becoming hyperechoic in presence of liver steatosis (A2). In comparison to a normal liver (B1), a fatty liver appears hypodense compared to the spleen and to the hepatic veins (B2) in computed tomography scans. Finally, in the setting of a severe steatosis, the magnetic resonance signal has a clear fall from in phase (C1) to out phase sequencings (C2).
- Citation: Leoni S, Tovoli F, Napoli L, Serio I, Ferri S, Bolondi L. Current guidelines for the management of non-alcoholic fatty liver disease: A systematic review with comparative analysis. World J Gastroenterol 2018; 24(30): 3361-3373
- URL: https://www.wjgnet.com/1007-9327/full/v24/i30/3361.htm
- DOI: https://dx.doi.org/10.3748/wjg.v24.i30.3361


