Copyright
©The Author(s) 2018.
World J Gastroenterol. Jan 21, 2018; 24(3): 338-350
Published online Jan 21, 2018. doi: 10.3748/wjg.v24.i3.338
Published online Jan 21, 2018. doi: 10.3748/wjg.v24.i3.338
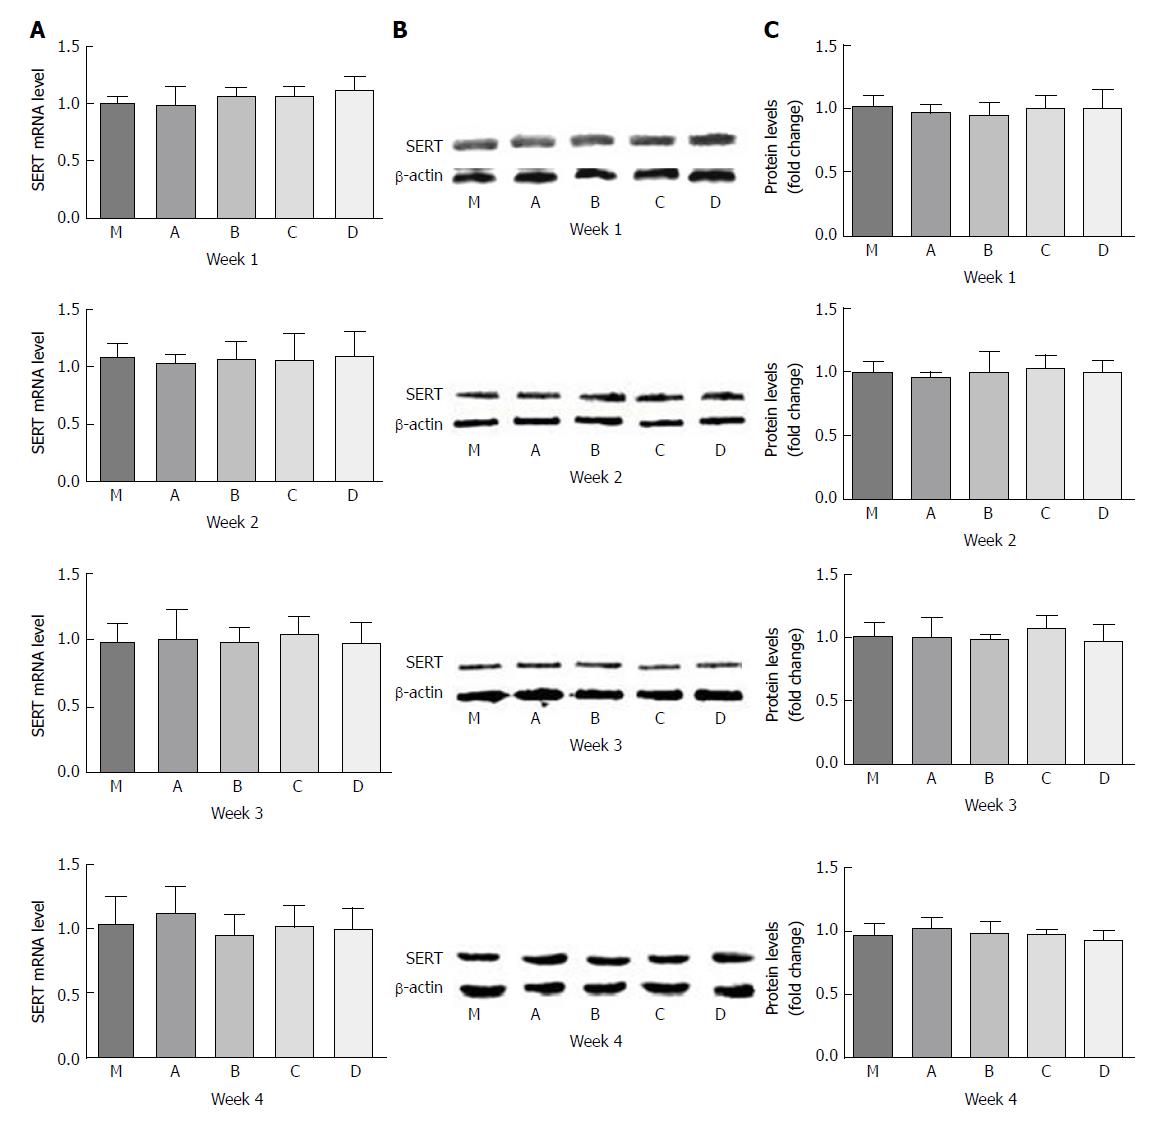
Figure 5 Effect of LGG-s on SERT mRNA and SERT-P expression in rat brain tissues.
A: SERT mRNA levels at the first, second, third, and fourth weeks; B: SERT-P levels at the first, second, third, and fourth weeks analyzed by Western blot; C: Quantitative analysis of SERT-P levels at the first, second, third, and fourth weeks analyzed by Western blot. Control group, n = 5; PI-IBS group, n = 5, each week.
- Citation: Cao YN, Feng LJ, Liu YY, Jiang K, Zhang MJ, Gu YX, Wang BM, Gao J, Wang ZL, Wang YM. Effect of Lactobacillus rhamnosus GG supernatant on serotonin transporter expression in rats with post-infectious irritable bowel syndrome. World J Gastroenterol 2018; 24(3): 338-350
- URL: https://www.wjgnet.com/1007-9327/full/v24/i3/338.htm
- DOI: https://dx.doi.org/10.3748/wjg.v24.i3.338


