Copyright
©The Author(s) 2018.
World J Gastroenterol. Jul 28, 2018; 24(28): 3145-3154
Published online Jul 28, 2018. doi: 10.3748/wjg.v24.i28.3145
Published online Jul 28, 2018. doi: 10.3748/wjg.v24.i28.3145
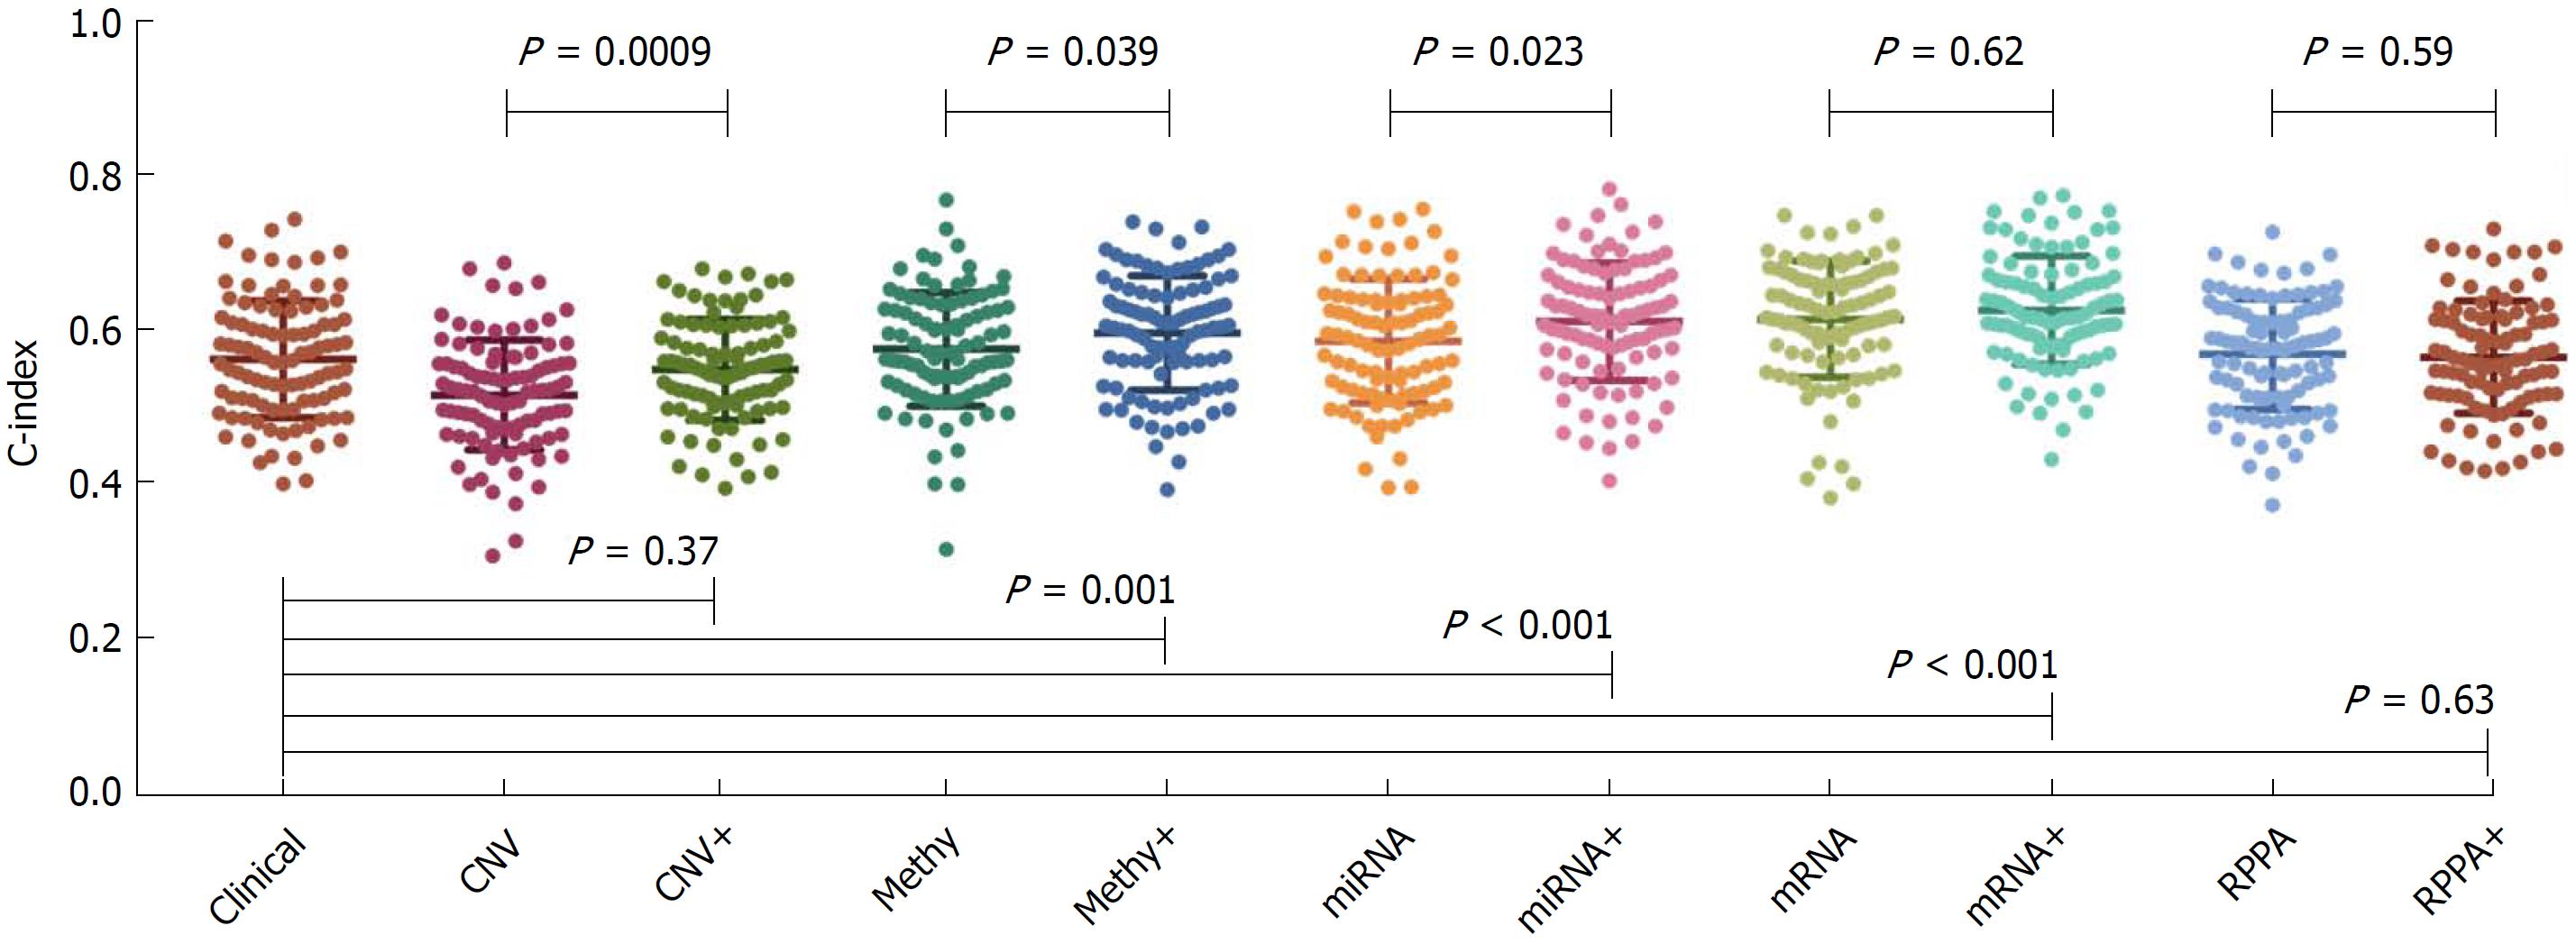
Figure 2 Prognostic powers of clinical data and different types of molecular data.
The concordance index (C-index) value on the left Y-axis indicated the prognostic power of each data type. The P values on the top half of the figure represented the comparisons between the molecular data alone and the combination data. The P values on the lower half of the figure represented the comparisons between the clinical data alone and the combination data.
- Citation: Song YZ, Li X, Li W, Wang Z, Li K, Xie FL, Zhang F. Integrated genomic analysis for prediction of survival for patients with liver cancer using The Cancer Genome Atlas. World J Gastroenterol 2018; 24(28): 3145-3154
- URL: https://www.wjgnet.com/1007-9327/full/v24/i28/3145.htm
- DOI: https://dx.doi.org/10.3748/wjg.v24.i28.3145


