Copyright
©The Author(s) 2018.
World J Gastroenterol. Jul 7, 2018; 24(25): 2764-2775
Published online Jul 7, 2018. doi: 10.3748/wjg.v24.i25.2764
Published online Jul 7, 2018. doi: 10.3748/wjg.v24.i25.2764
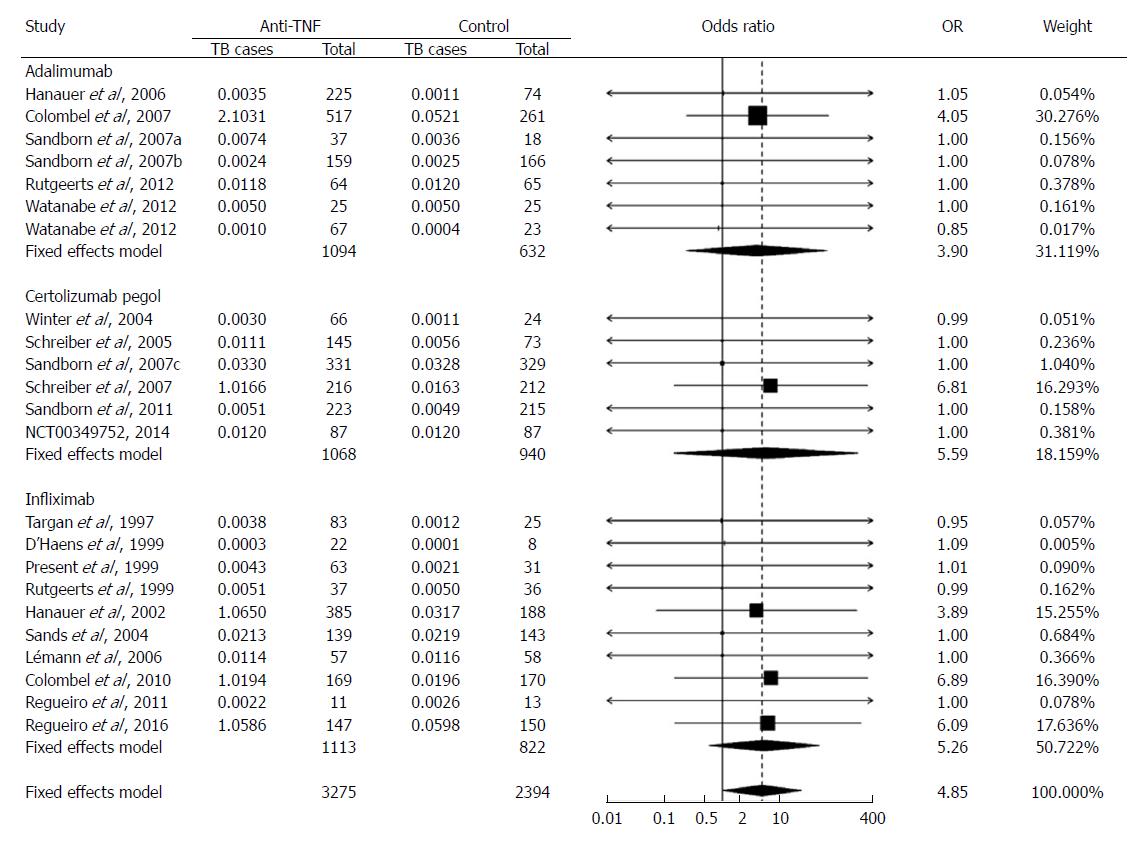
Figure 4 Odds of patients developing active Mycobacterium tuberculosis when treated with tumor necrosis factor-alpha inhibitors for Crohn’s disease relative to those treated with placebo.
Odds ratio (OR) was calculated using the Yusuf-Peto method and indicated by the numbers on the x-axis. Number of Mycobacterium tuberculosis cases was modified using the background Mycobacterium tuberculosis incidence, i.e., adding to the reported number of Mycobacterium tuberculosis cases with a number (less than 1) that might be expected from a given number of patients (listed under “Total”). Weight: the percentage contribution of an individual study to the pooled estimate. The vertical dashed line indicates the pooled odds ratio. The solid horizontal lines show the confidence interval (CI). The size of the black box and diamond is proportional to the corresponding weight. Mycobacterium tuberculosis here denotes tuberculosis.
- Citation: Cao BL, Qasem A, Sharp RC, Abdelli LS, Naser SA. Systematic review and meta-analysis on the association of tuberculosis in Crohn’s disease patients treated with tumor necrosis factor-α inhibitors (Anti-TNFα). World J Gastroenterol 2018; 24(25): 2764-2775
- URL: https://www.wjgnet.com/1007-9327/full/v24/i25/2764.htm
- DOI: https://dx.doi.org/10.3748/wjg.v24.i25.2764


