Copyright
©The Author(s) 2018.
World J Gastroenterol. Jun 21, 2018; 24(23): 2468-2481
Published online Jun 21, 2018. doi: 10.3748/wjg.v24.i23.2468
Published online Jun 21, 2018. doi: 10.3748/wjg.v24.i23.2468
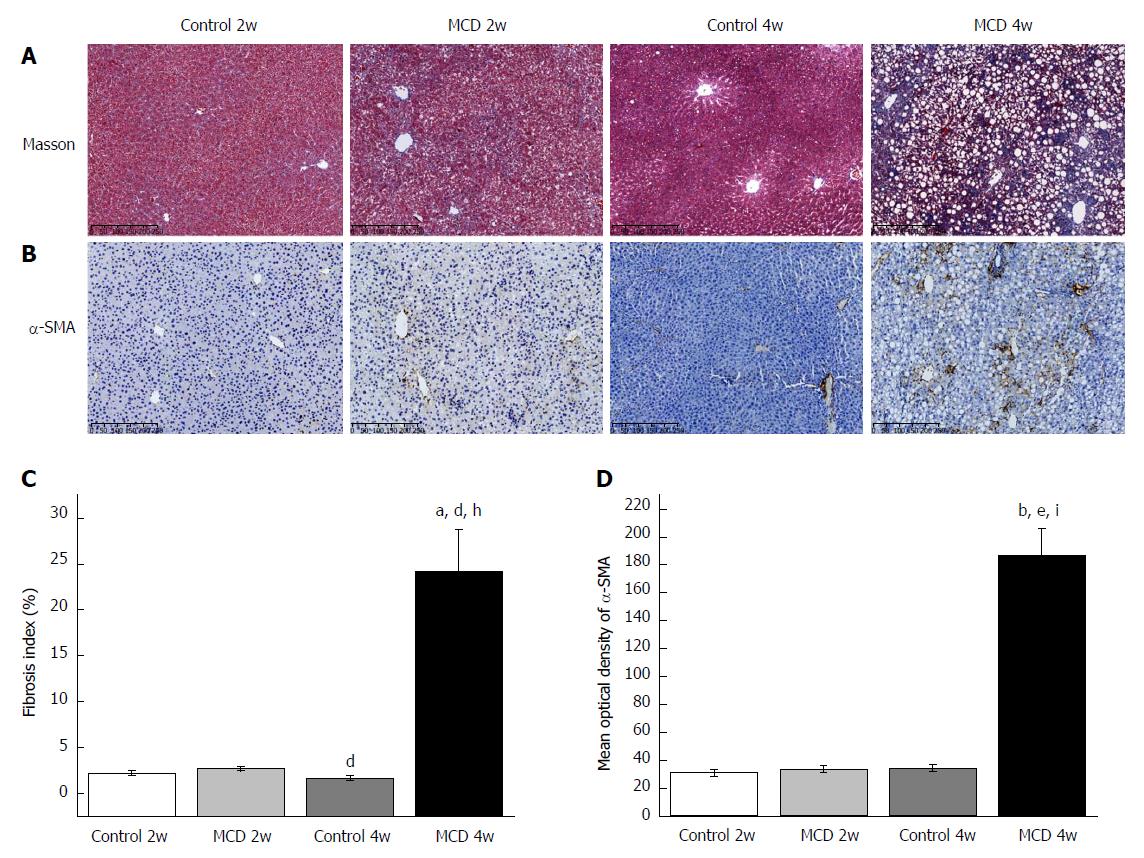
Figure 2 Methionine-choline-deficient diet induced liver fibrosis after 4 wk of feeding.
A-B: Representative liver histology assessed by Masson’s trichrome staining (A) and α-SMA staining (B). Scale bar: 250 μm. C: Percent of Masson’s trichrome-stained area as indicated by the fibrosis index (%). D: Representative staining intensities of α-SMA as designated by the mean optical density. The data are given as the means ± SEM. n = 6 per group. aP < 0.05 and bP < 0.01 vs Control 2w group, dP < 0.05 and eP < 0.01 vs MCD 2w group, hP < 0.05 and iP < 0.01 vs Control 4w group by post hoc ANOVA one-way statistical analysis. MCD: Methionine-choline-deficient.
- Citation: Ye JZ, Li YT, Wu WR, Shi D, Fang DQ, Yang LY, Bian XY, Wu JJ, Wang Q, Jiang XW, Peng CG, Ye WC, Xia PC, Li LJ. Dynamic alterations in the gut microbiota and metabolome during the development of methionine-choline-deficient diet-induced nonalcoholic steatohepatitis. World J Gastroenterol 2018; 24(23): 2468-2481
- URL: https://www.wjgnet.com/1007-9327/full/v24/i23/2468.htm
- DOI: https://dx.doi.org/10.3748/wjg.v24.i23.2468


