Copyright
©The Author(s) 2018.
World J Gastroenterol. Jun 14, 2018; 24(22): 2400-2405
Published online Jun 14, 2018. doi: 10.3748/wjg.v24.i22.2400
Published online Jun 14, 2018. doi: 10.3748/wjg.v24.i22.2400
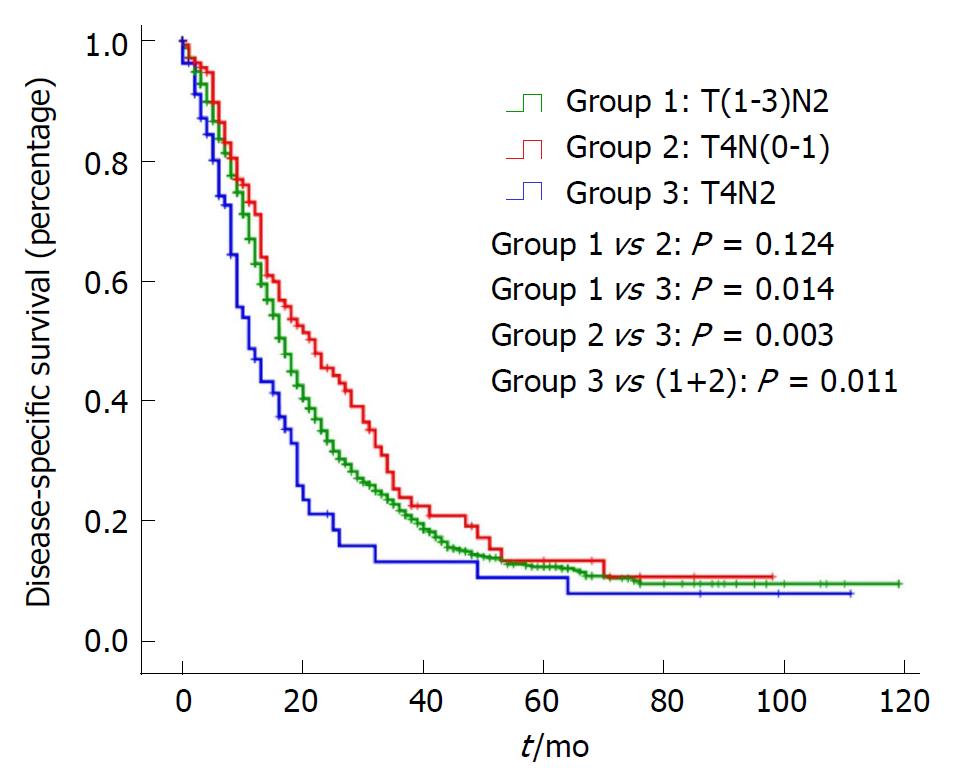
Figure 2 Kaplan-Meier analyses of disease-specific survival N stage III pancreatic cancer patients.
There was no significant difference between the T(1-3)N2 and T4N(0-1) groups (P = 0.124). However, compared with stage T4N2, the DSS curve of T(1-3)N2/T4N(0-1) was significantly better [stage T(1-3)N2 vs T4N2: P = 0.014; stage T4N(0-1) vs T4N2: P = 0.003; stage T(1-3)N2 + T4N(0-1) vs T4N2: P = 0.011]. DSS: Disease-specific survival.
- Citation: Yu HF, Zhao BQ, Li YC, Fu J, Jiang W, Xu RW, Yang HC, Zhang XJ. Stage III should be subclassified into Stage IIIA and IIIB in the American Joint Committee on Cancer (8th Edition) staging system for pancreatic cancer. World J Gastroenterol 2018; 24(22): 2400-2405
- URL: https://www.wjgnet.com/1007-9327/full/v24/i22/2400.htm
- DOI: https://dx.doi.org/10.3748/wjg.v24.i22.2400


