Copyright
©The Author(s) 2018.
World J Gastroenterol. Jun 14, 2018; 24(22): 2381-2391
Published online Jun 14, 2018. doi: 10.3748/wjg.v24.i22.2381
Published online Jun 14, 2018. doi: 10.3748/wjg.v24.i22.2381
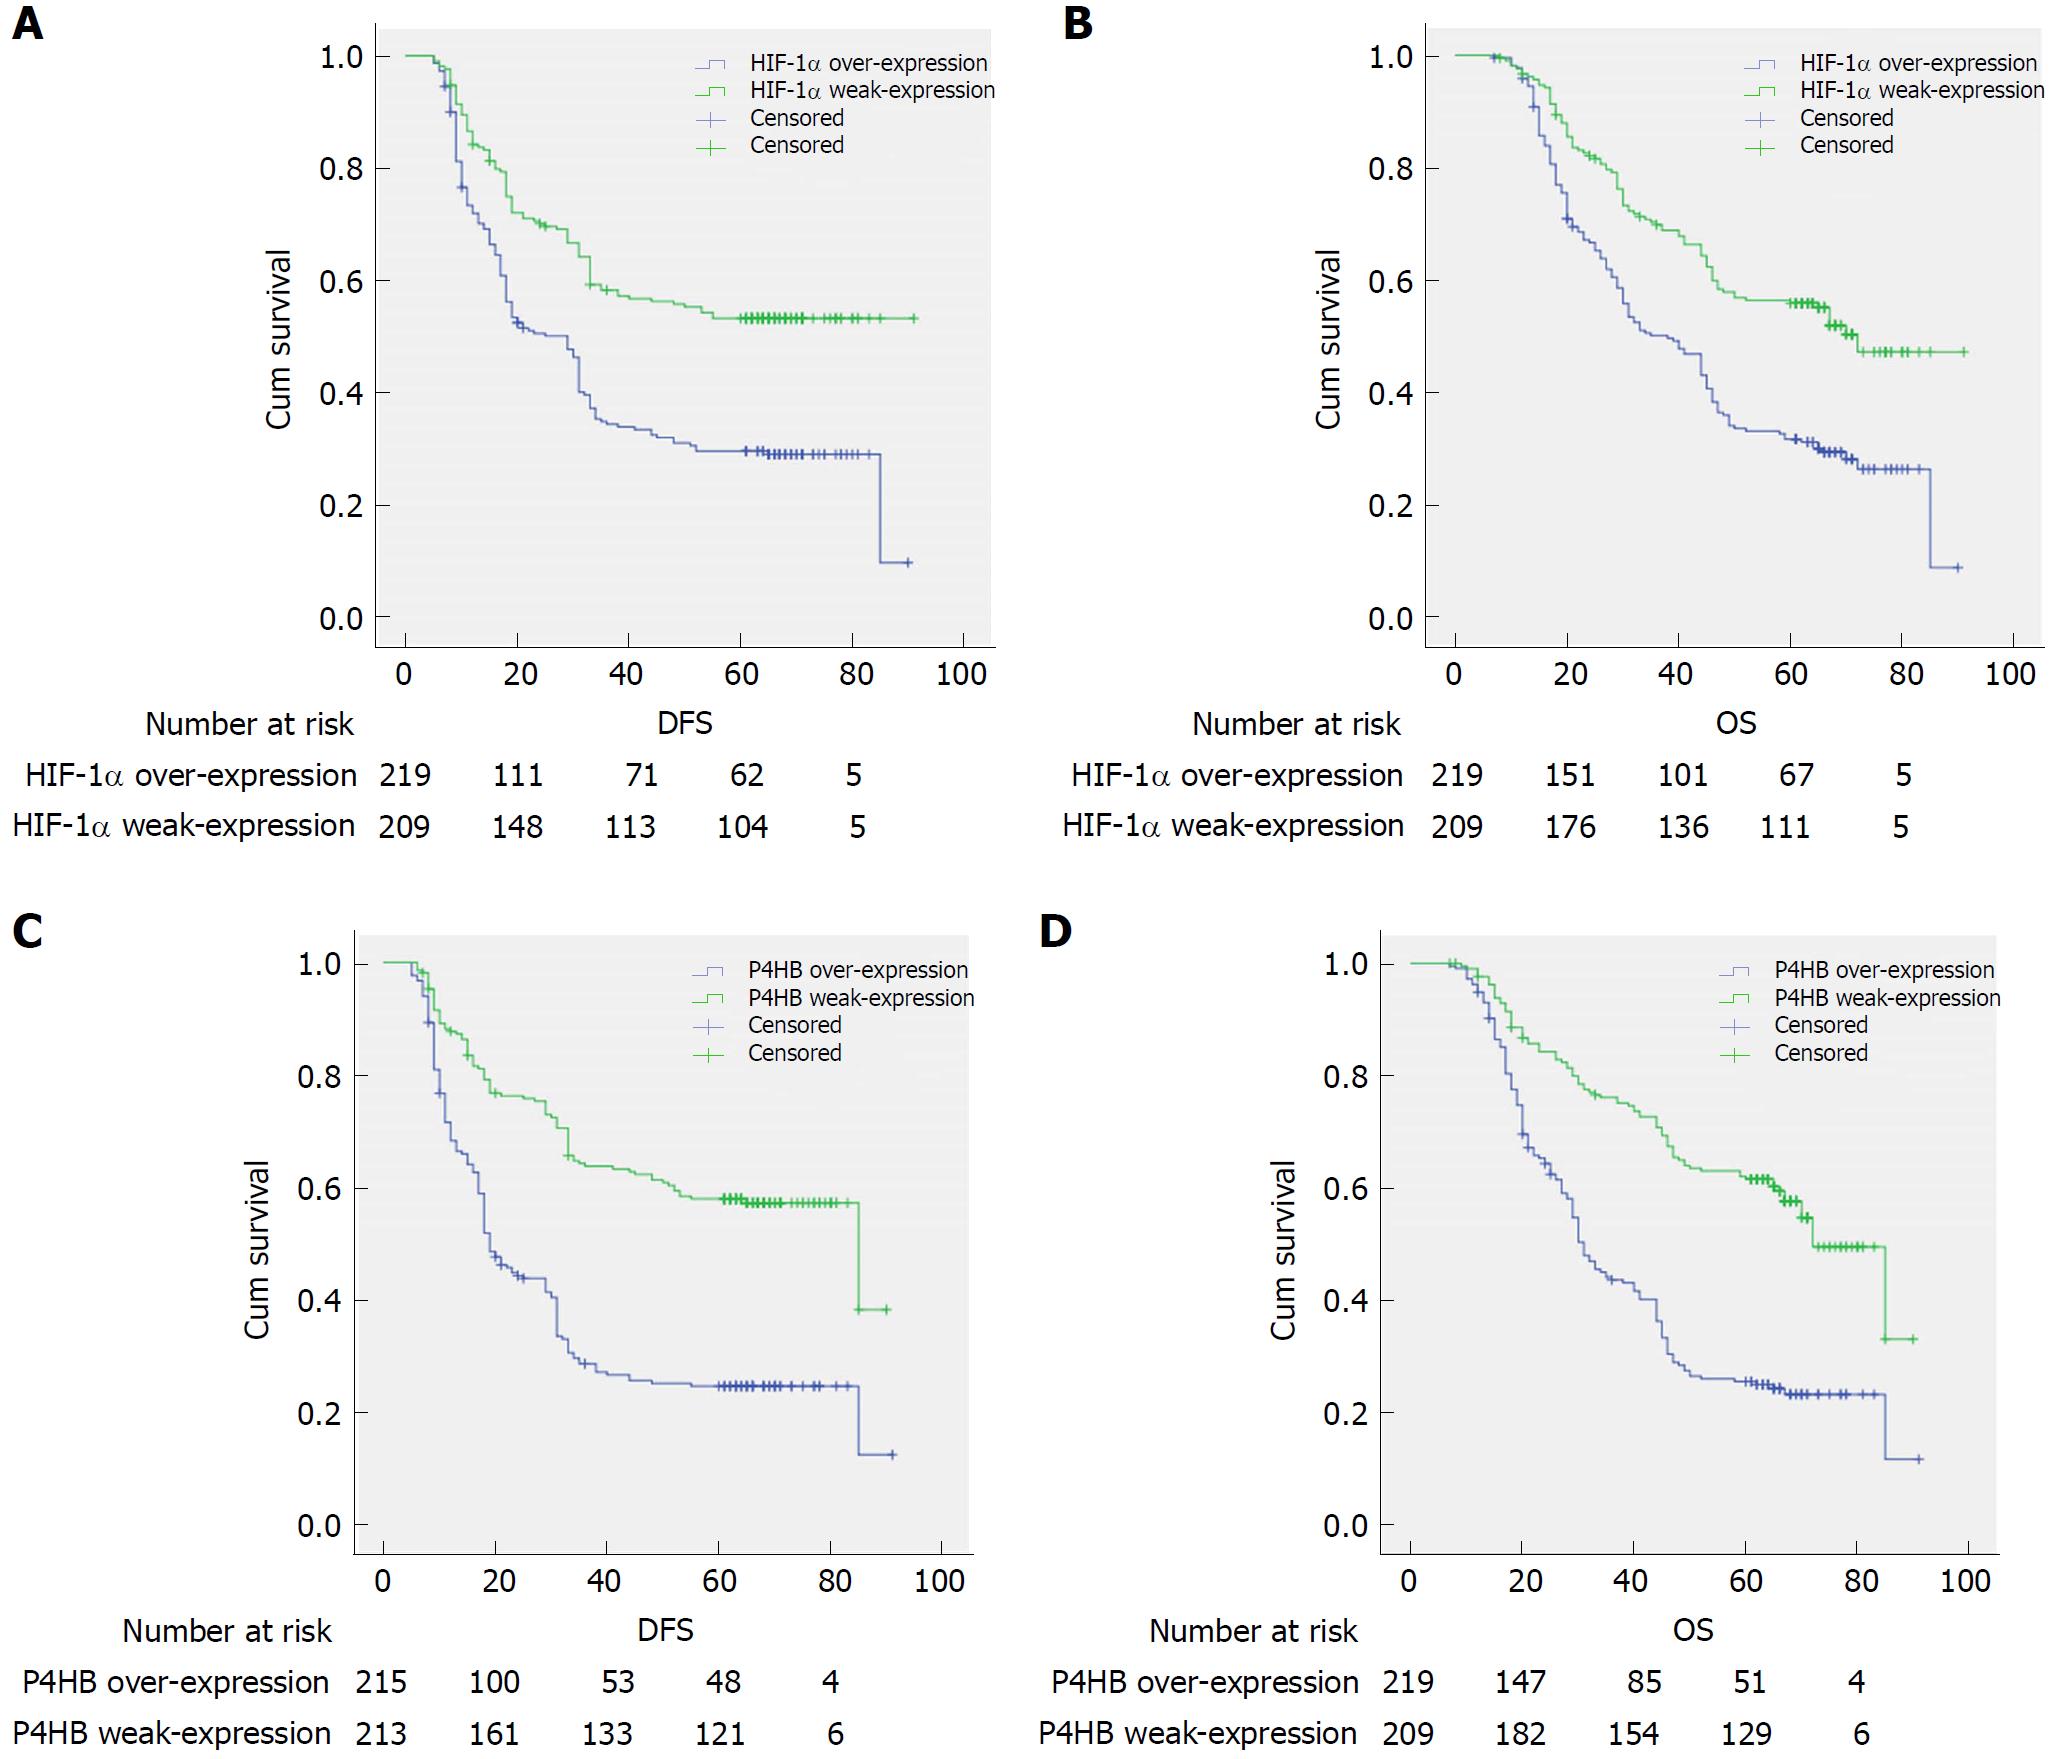
Figure 3 Kaplan-Meier curves for disease-free survival and overall survival.
A: Disease free survival curves stratified by HIF-1α expression (P = 0.00); B: Overall survival curves stratified by HIF-1α expression (P = 0.00); C: Disease free survival curves stratified by P4HB expression (P = 0.00); D: Overall survival curves stratified by P4HB expression (P = 0.00). Patients were divided into an over-expression group and a weak-expression group, according to expression of HIF-1α and P4HB. Log-rank test was used to evaluate significance. HIF-1α: Hypoxia-inducible factor-1α; P4HB: Prolyl 4-hydroxylase beta.
- Citation: Zhang J, Wu Y, Lin YH, Guo S, Ning PF, Zheng ZC, Wang Y, Zhao Y. Prognostic value of hypoxia-inducible factor-1 alpha and prolyl 4-hydroxylase beta polypeptide overexpression in gastric cancer. World J Gastroenterol 2018; 24(22): 2381-2391
- URL: https://www.wjgnet.com/1007-9327/full/v24/i22/2381.htm
- DOI: https://dx.doi.org/10.3748/wjg.v24.i22.2381


