Copyright
©The Author(s) 2018.
World J Gastroenterol. Jan 14, 2018; 24(2): 248-256
Published online Jan 14, 2018. doi: 10.3748/wjg.v24.i2.248
Published online Jan 14, 2018. doi: 10.3748/wjg.v24.i2.248
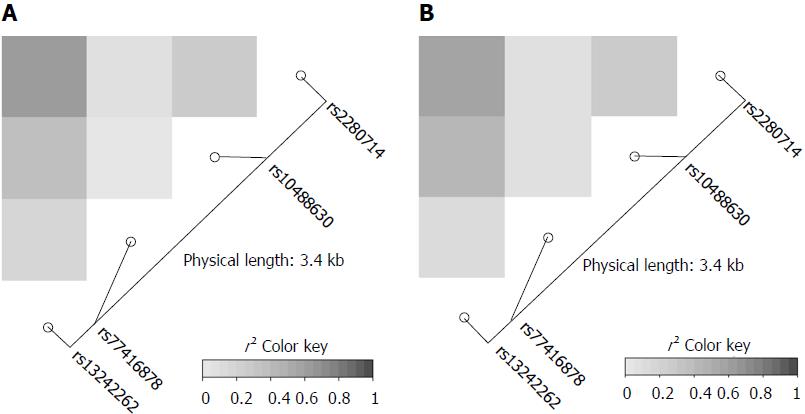
Figure 1 IRF5 linkage disequilibrium maps.
Pairwise r2 between 4 polymorphisms in the IRF5 locus in the 3’ UTR region in Vietnamese hepatitis B virus infected patients (A) and in healthy controls (B) are presented. The color scale from white to dark indicates r2 values from 0 to 1. The blocks of grey and dark grey represent SNPs that are all in high linkage disequilibrium with each other.
- Citation: Sy BT, Hoan NX, Tong HV, Meyer CG, Toan NL, Song LH, Bock CT, Velavan TP. Genetic variants of interferon regulatory factor 5 associated with chronic hepatitis B infection. World J Gastroenterol 2018; 24(2): 248-256
- URL: https://www.wjgnet.com/1007-9327/full/v24/i2/248.htm
- DOI: https://dx.doi.org/10.3748/wjg.v24.i2.248


