Copyright
©The Author(s) 2018.
World J Gastroenterol. Jan 14, 2018; 24(2): 179-194
Published online Jan 14, 2018. doi: 10.3748/wjg.v24.i2.179
Published online Jan 14, 2018. doi: 10.3748/wjg.v24.i2.179
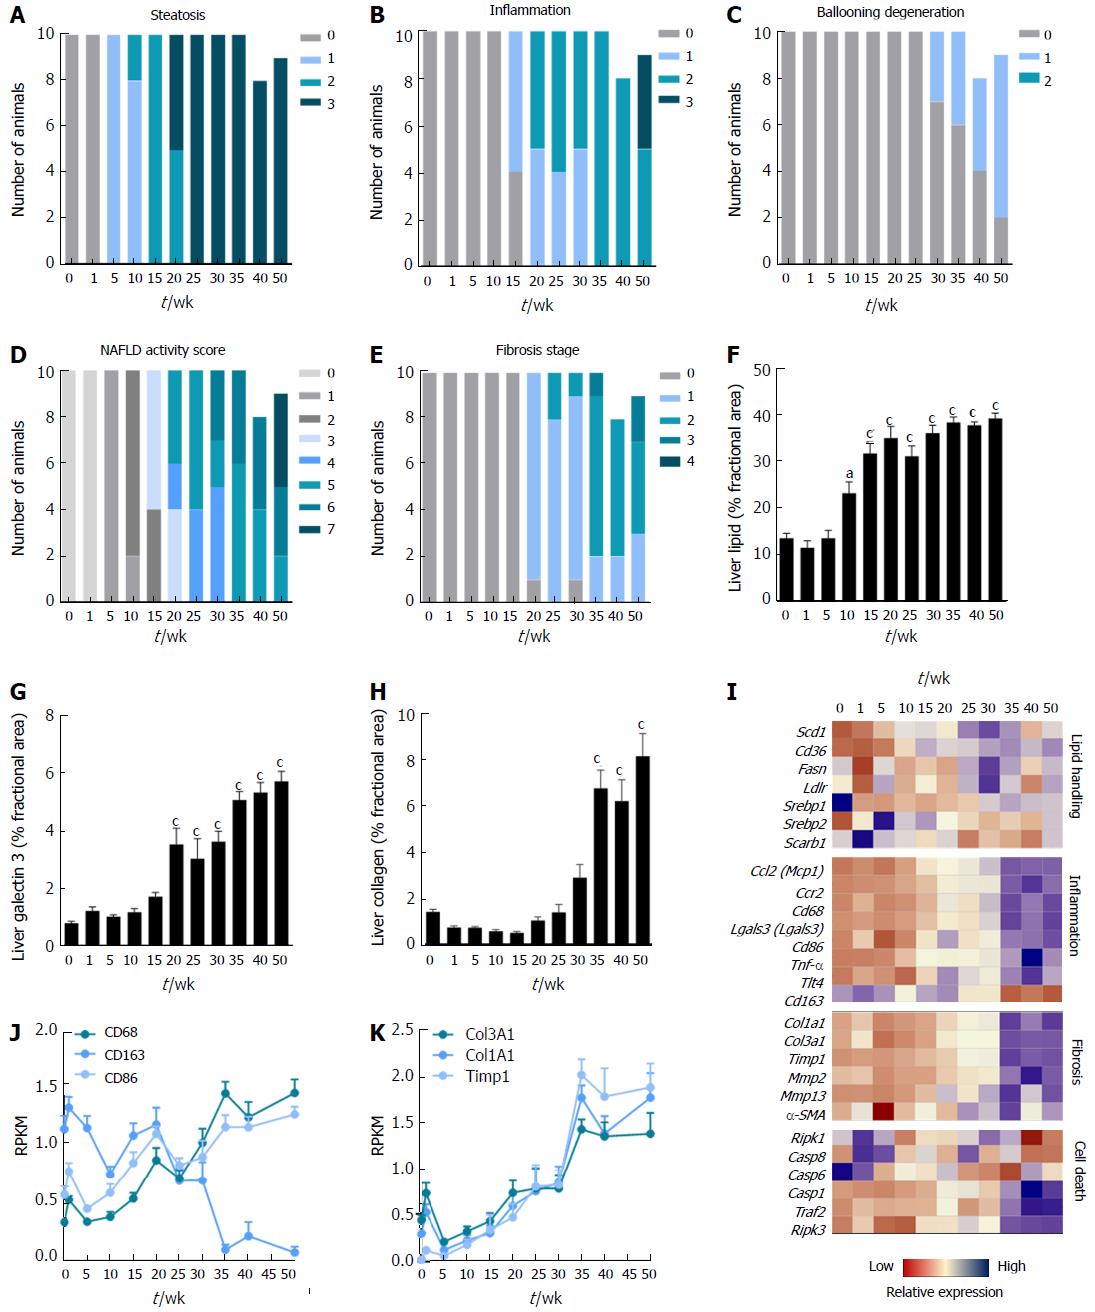
Figure 1 Disease progression in DIO-nonalcoholic steatohepatitis mice.
A-E: Individual and composite NAFLD activity scores (NAS) and fibrosis stage; F-H: Quantitative analysis of liver lipid, galectin-3 and collagen 1a1 fractional area; I-K: Heatmap on liver transcriptome changes and expression of selected genes. aP < 0.05, cP < 0.001 vs week 0. NASH: Nonalcoholic steatohepatitis.
- Citation: Tølbøl KS, Kristiansen MN, Hansen HH, Veidal SS, Rigbolt KT, Gillum MP, Jelsing J, Vrang N, Feigh M. Metabolic and hepatic effects of liraglutide, obeticholic acid and elafibranor in diet-induced obese mouse models of biopsy-confirmed nonalcoholic steatohepatitis. World J Gastroenterol 2018; 24(2): 179-194
- URL: https://www.wjgnet.com/1007-9327/full/v24/i2/179.htm
- DOI: https://dx.doi.org/10.3748/wjg.v24.i2.179


