Copyright
©The Author(s) 2018.
World J Gastroenterol. May 21, 2018; 24(19): 2095-2107
Published online May 21, 2018. doi: 10.3748/wjg.v24.i19.2095
Published online May 21, 2018. doi: 10.3748/wjg.v24.i19.2095
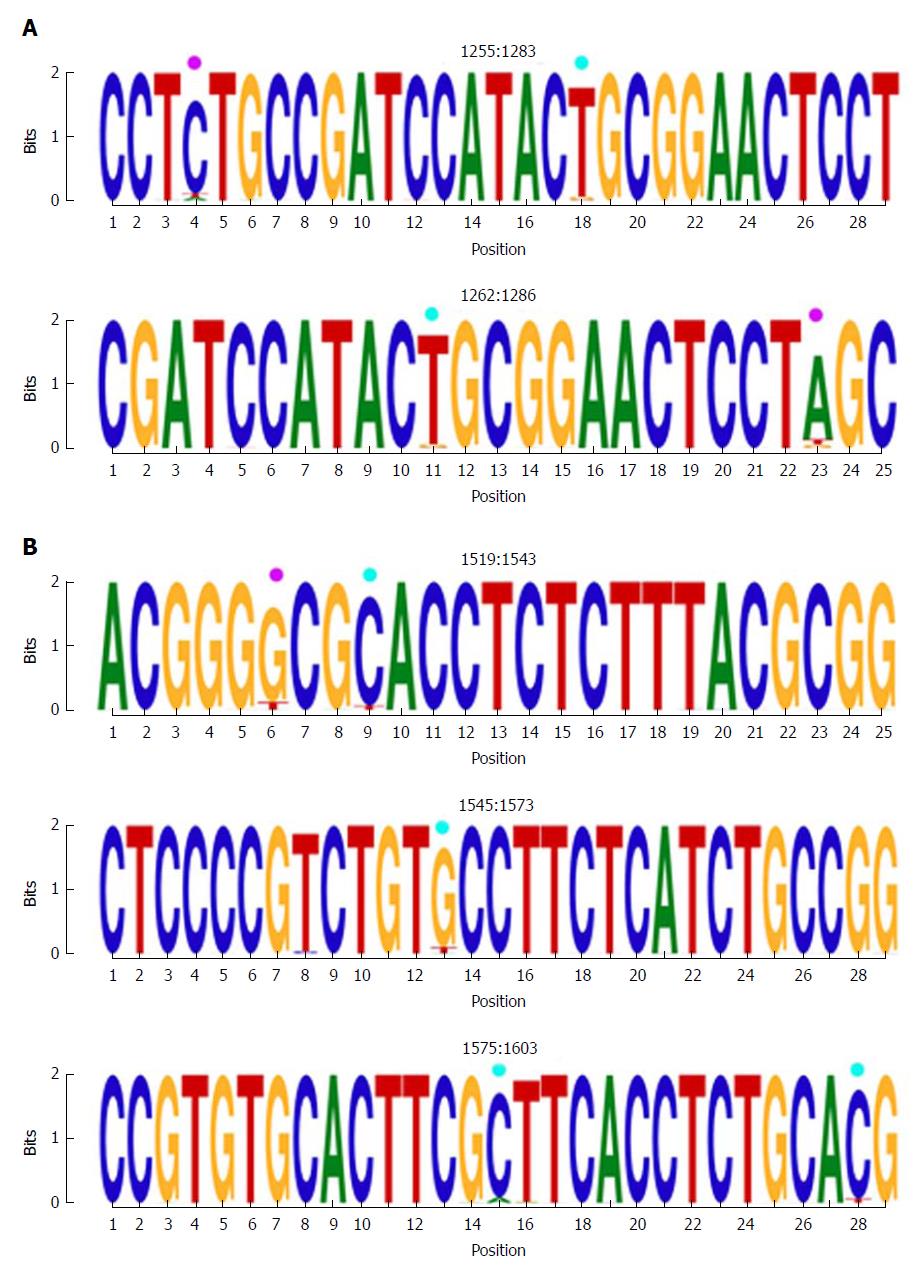
Figure 3 Representation by sequence logos of the information content of the most conserved regions detected in the multiple alignment of all nucleotide haplotypes obtained (quasispecies), nts 1255-1286 and nts 1519-1603.
The relative sizes of the letters in each stack of nt sequence logos indicate their relative frequencies at each position within the multiple alignments of nt haplotypes. The total height of each stack of letters depicts the IC of each nt position, measured in bits (Y-axis): 0 bits being the minimum and 2, the maximum conservation. Nucleotide positions with an IC between 1.6 and 1.8 (80%-90% of maximum conservation) are indicated by light blue circles and those with an IC between 1.4 and 1.6 bits (70%-80% of maximum conservation) by pink circles. IC: Information content.
- Citation: González C, Tabernero D, Cortese MF, Gregori J, Casillas R, Riveiro-Barciela M, Godoy C, Sopena S, Rando A, Yll M, Lopez-Martinez R, Quer J, Esteban R, Buti M, Rodríguez-Frías F. Detection of hyper-conserved regions in hepatitis B virus X gene potentially useful for gene therapy. World J Gastroenterol 2018; 24(19): 2095-2107
- URL: https://www.wjgnet.com/1007-9327/full/v24/i19/2095.htm
- DOI: https://dx.doi.org/10.3748/wjg.v24.i19.2095


