Copyright
©The Author(s) 2018.
World J Gastroenterol. May 21, 2018; 24(19): 2095-2107
Published online May 21, 2018. doi: 10.3748/wjg.v24.i19.2095
Published online May 21, 2018. doi: 10.3748/wjg.v24.i19.2095
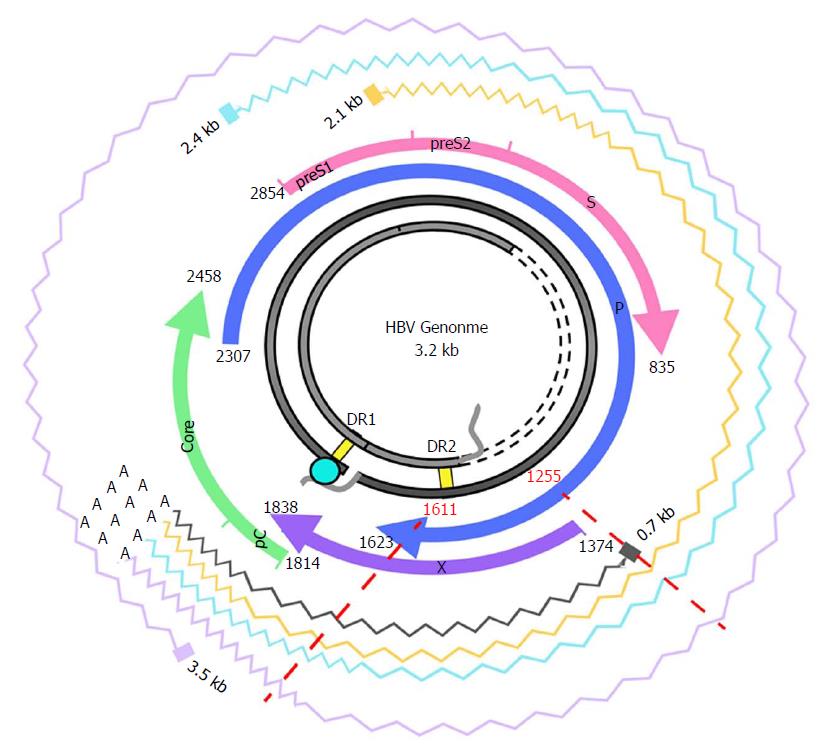
Figure 1 Hepatitis B virus genome and transcripts.
The figure shows the HBV genome (in grey), with the DR1 and DR2 (direct repeat) regions, necessary for viral DNA synthesis. The viral ORFs are highlighted with colored arrows, and nucleotide positions are reported. Wavy lines show the various HBV transcripts: the 3.5-kb transcript, corresponding to the pregenomic RNA, which is translated to the core and polymerase and later subjected to reverse-transcription in the viral capsid, or to the precore/core transcript, which is translated to the precore protein; the 2.4-kb and 2.1-kb transcripts, which are translated, respectively, to large and medium/small HBsAg); and the 0.7-kB transcript, which is translated to the HBx protein. The region analyzed in this study and its corresponding nt positions are indicated by red dashed lines. Note that the region of interest is included in all the viral transcripts. HBV: Hepatitis B virus; ORF: Open reading frame.
- Citation: González C, Tabernero D, Cortese MF, Gregori J, Casillas R, Riveiro-Barciela M, Godoy C, Sopena S, Rando A, Yll M, Lopez-Martinez R, Quer J, Esteban R, Buti M, Rodríguez-Frías F. Detection of hyper-conserved regions in hepatitis B virus X gene potentially useful for gene therapy. World J Gastroenterol 2018; 24(19): 2095-2107
- URL: https://www.wjgnet.com/1007-9327/full/v24/i19/2095.htm
- DOI: https://dx.doi.org/10.3748/wjg.v24.i19.2095


