Copyright
©The Author(s) 2018.
World J Gastroenterol. May 14, 2018; 24(18): 2024-2035
Published online May 14, 2018. doi: 10.3748/wjg.v24.i18.2024
Published online May 14, 2018. doi: 10.3748/wjg.v24.i18.2024
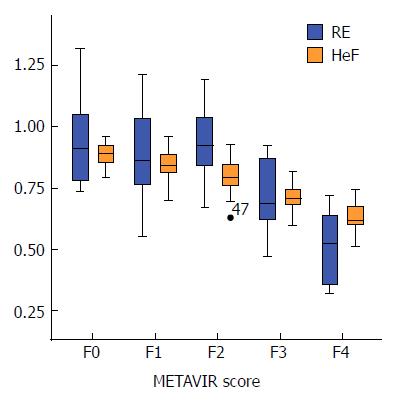
Figure 5 Box-and-whisker plots of T1 values.
RE and HeF are shown for each METAVIR stage in relation to CHB and CHC. T1 values are reported on the Y-axis, and METAVIR stage of fibrosis is reported on the X-axis. CHB: Chronic hepatitis B; CHC: Chronic hepatitis C; HeF: Hepatocyte fraction; RE: Reduction rate of T1 relaxation time.
- Citation: Pan S, Wang XQ, Guo QY. Quantitative assessment of hepatic fibrosis in chronic hepatitis B and C: T1 mapping on Gd-EOB-DTPA-enhanced liver magnetic resonance imaging. World J Gastroenterol 2018; 24(18): 2024-2035
- URL: https://www.wjgnet.com/1007-9327/full/v24/i18/2024.htm
- DOI: https://dx.doi.org/10.3748/wjg.v24.i18.2024


