Copyright
©The Author(s) 2018.
World J Gastroenterol. Mar 28, 2018; 24(12): 1299-1311
Published online Mar 28, 2018. doi: 10.3748/wjg.v24.i12.1299
Published online Mar 28, 2018. doi: 10.3748/wjg.v24.i12.1299
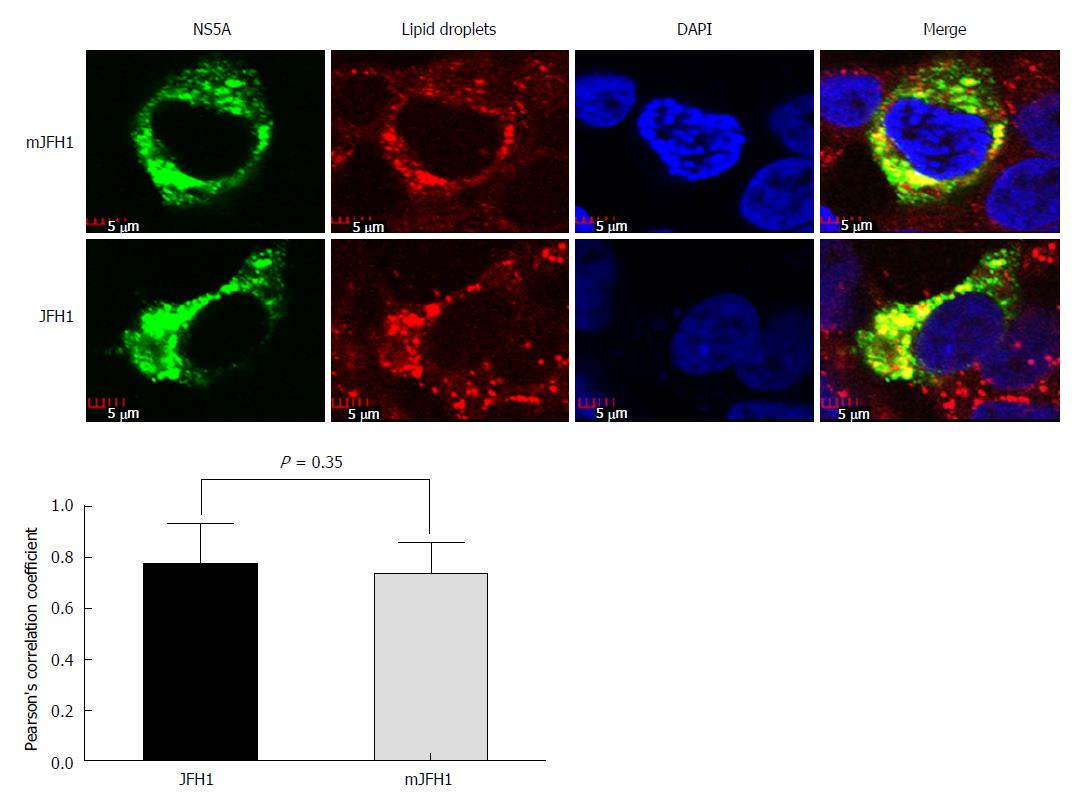
Figure 5 Colocalization analysis of lipid droplets and hepatitis C virus NS5A.
JFH1 and mJFH1 RNA was electroporated into Huh7.5 cells to produce the recombinants of adapted virus. At 48 h after transfection, the cells were fixed. Lipid droplets were stained with LipidTOXRed (Red). The HCV NS5A was stained with anti-NS5A antibody (Green). The nucleus was stained with DAPI (Blue). Each triplicate sample of 25 cells was analyzed using Image J software. The degree of co-localization was quantified and compared using Pearson’s correlation coefficients.
- Citation: Wang Q, Li Y, Liu SA, Xie W, Cheng J. Cell culture-adaptive mutations in hepatitis C virus promote viral production by enhancing viral replication and release. World J Gastroenterol 2018; 24(12): 1299-1311
- URL: https://www.wjgnet.com/1007-9327/full/v24/i12/1299.htm
- DOI: https://dx.doi.org/10.3748/wjg.v24.i12.1299


