Copyright
©The Author(s) 2018.
World J Gastroenterol. Mar 21, 2018; 24(11): 1239-1249
Published online Mar 21, 2018. doi: 10.3748/wjg.v24.i11.1239
Published online Mar 21, 2018. doi: 10.3748/wjg.v24.i11.1239
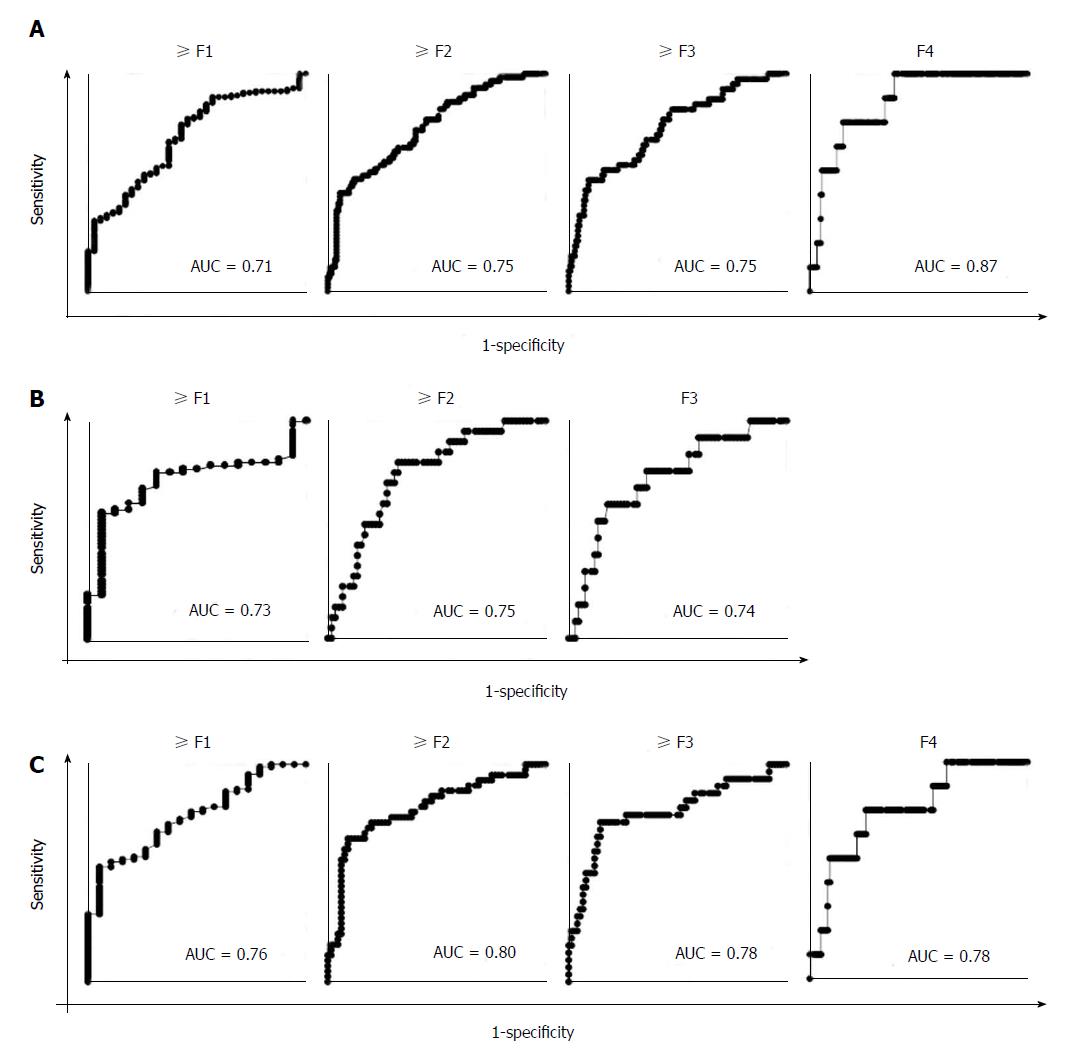
Figure 4 Receiver operating characteristic analysis of autotaxin for the estimation of the presence of fibrosis (≥ F1), significant fibrosis (≥ F2), severe fibrosis (≥ F3), and cirrhosis (F4) in all (A), male (B), and female (C) patients.
The areas under the receiver operating characteristic curve are displayed in the lower right of each graph. AUC: Receiver operating characteristic curve; F: Fibrosis.
- Citation: Fujimori N, Umemura T, Kimura T, Tanaka N, Sugiura A, Yamazaki T, Joshita S, Komatsu M, Usami Y, Sano K, Igarashi K, Matsumoto A, Tanaka E. Serum autotaxin levels are correlated with hepatic fibrosis and ballooning in patients with non-alcoholic fatty liver disease. World J Gastroenterol 2018; 24(11): 1239-1249
- URL: https://www.wjgnet.com/1007-9327/full/v24/i11/1239.htm
- DOI: https://dx.doi.org/10.3748/wjg.v24.i11.1239


