Copyright
©The Author(s) 2018.
World J Gastroenterol. Mar 21, 2018; 24(11): 1206-1215
Published online Mar 21, 2018. doi: 10.3748/wjg.v24.i11.1206
Published online Mar 21, 2018. doi: 10.3748/wjg.v24.i11.1206
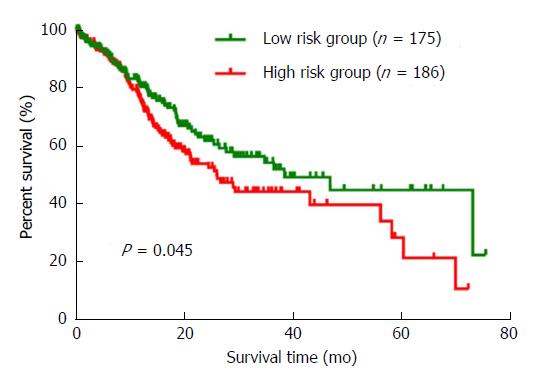
Figure 4 The Kaplan-Meier curve for the three-miRNA signature in gastric cancer.
The three differentially expressed miRNAs were ranked by the median of expression and then scored for each gastric cancer patient in accordance with high or low-level expression. The low risk group (n = 175) and high risk group (n = 186) were defined by the total scores. Compared to the low risk group, patients in the high risk group had a poorer prognosis (P = 0.045).
- Citation: Zhang C, Zhang CD, Ma MH, Dai DQ. Three-microRNA signature identified by bioinformatics analysis predicts prognosis of gastric cancer patients. World J Gastroenterol 2018; 24(11): 1206-1215
- URL: https://www.wjgnet.com/1007-9327/full/v24/i11/1206.htm
- DOI: https://dx.doi.org/10.3748/wjg.v24.i11.1206


