Copyright
©The Author(s) 2018.
World J Gastroenterol. Mar 21, 2018; 24(11): 1206-1215
Published online Mar 21, 2018. doi: 10.3748/wjg.v24.i11.1206
Published online Mar 21, 2018. doi: 10.3748/wjg.v24.i11.1206
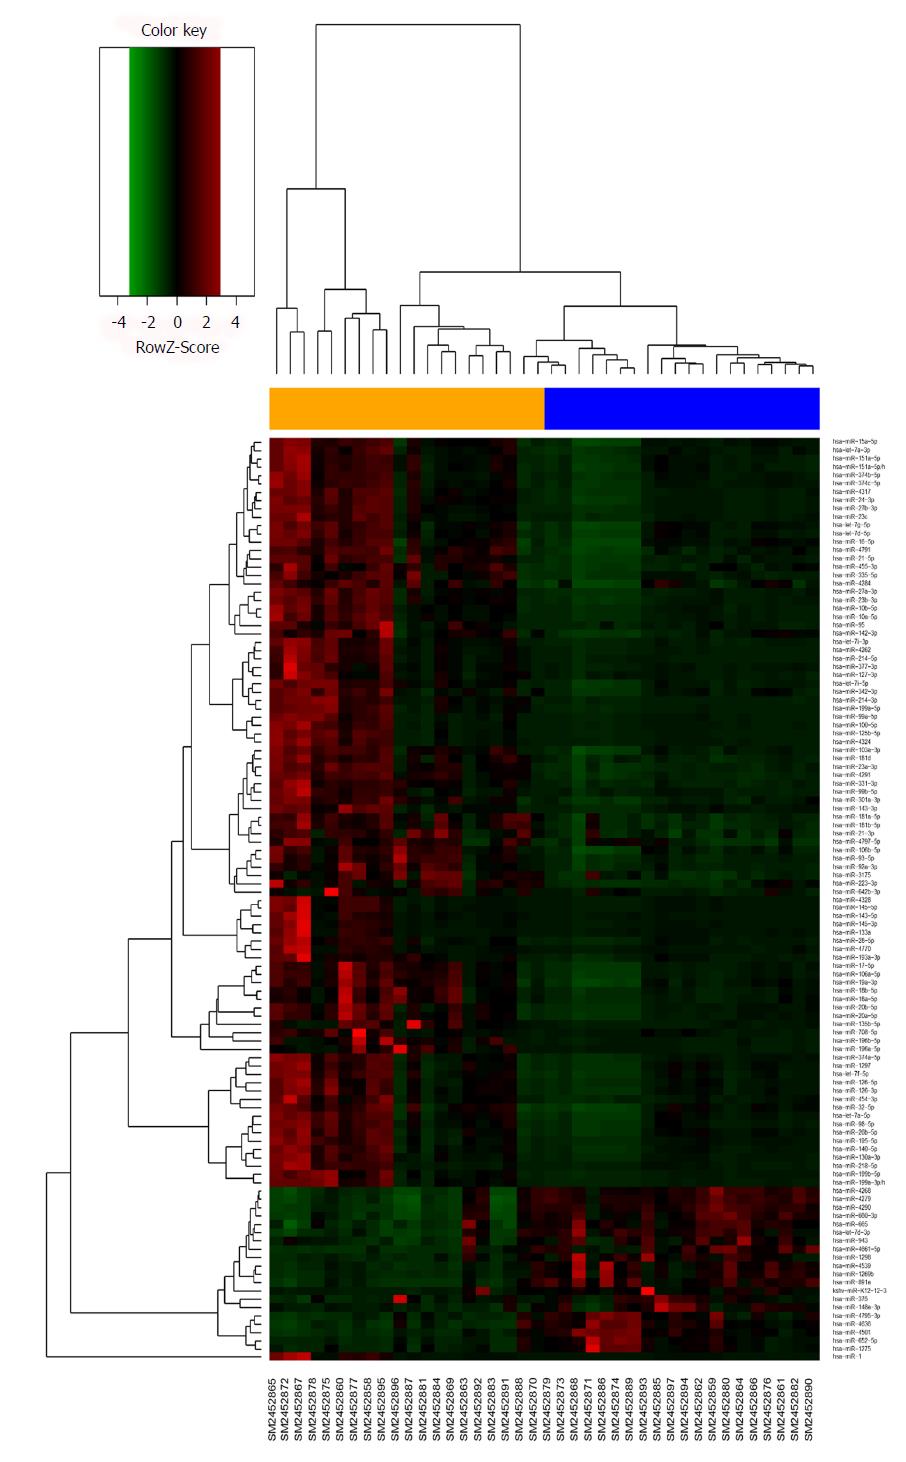
Figure 2 Hierarchical clustering analysis of the differentially expressed miRNAs between 20 pairs of gastric cancer and adjacent normal sample.
Each row represents the expression of an miRNA and each column represents a sample: orange color for gastric cancer, blue for normal.
- Citation: Zhang C, Zhang CD, Ma MH, Dai DQ. Three-microRNA signature identified by bioinformatics analysis predicts prognosis of gastric cancer patients. World J Gastroenterol 2018; 24(11): 1206-1215
- URL: https://www.wjgnet.com/1007-9327/full/v24/i11/1206.htm
- DOI: https://dx.doi.org/10.3748/wjg.v24.i11.1206


