Copyright
©The Author(s) 2018.
World J Gastroenterol. Mar 14, 2018; 24(10): 1107-1119
Published online Mar 14, 2018. doi: 10.3748/wjg.v24.i10.1107
Published online Mar 14, 2018. doi: 10.3748/wjg.v24.i10.1107
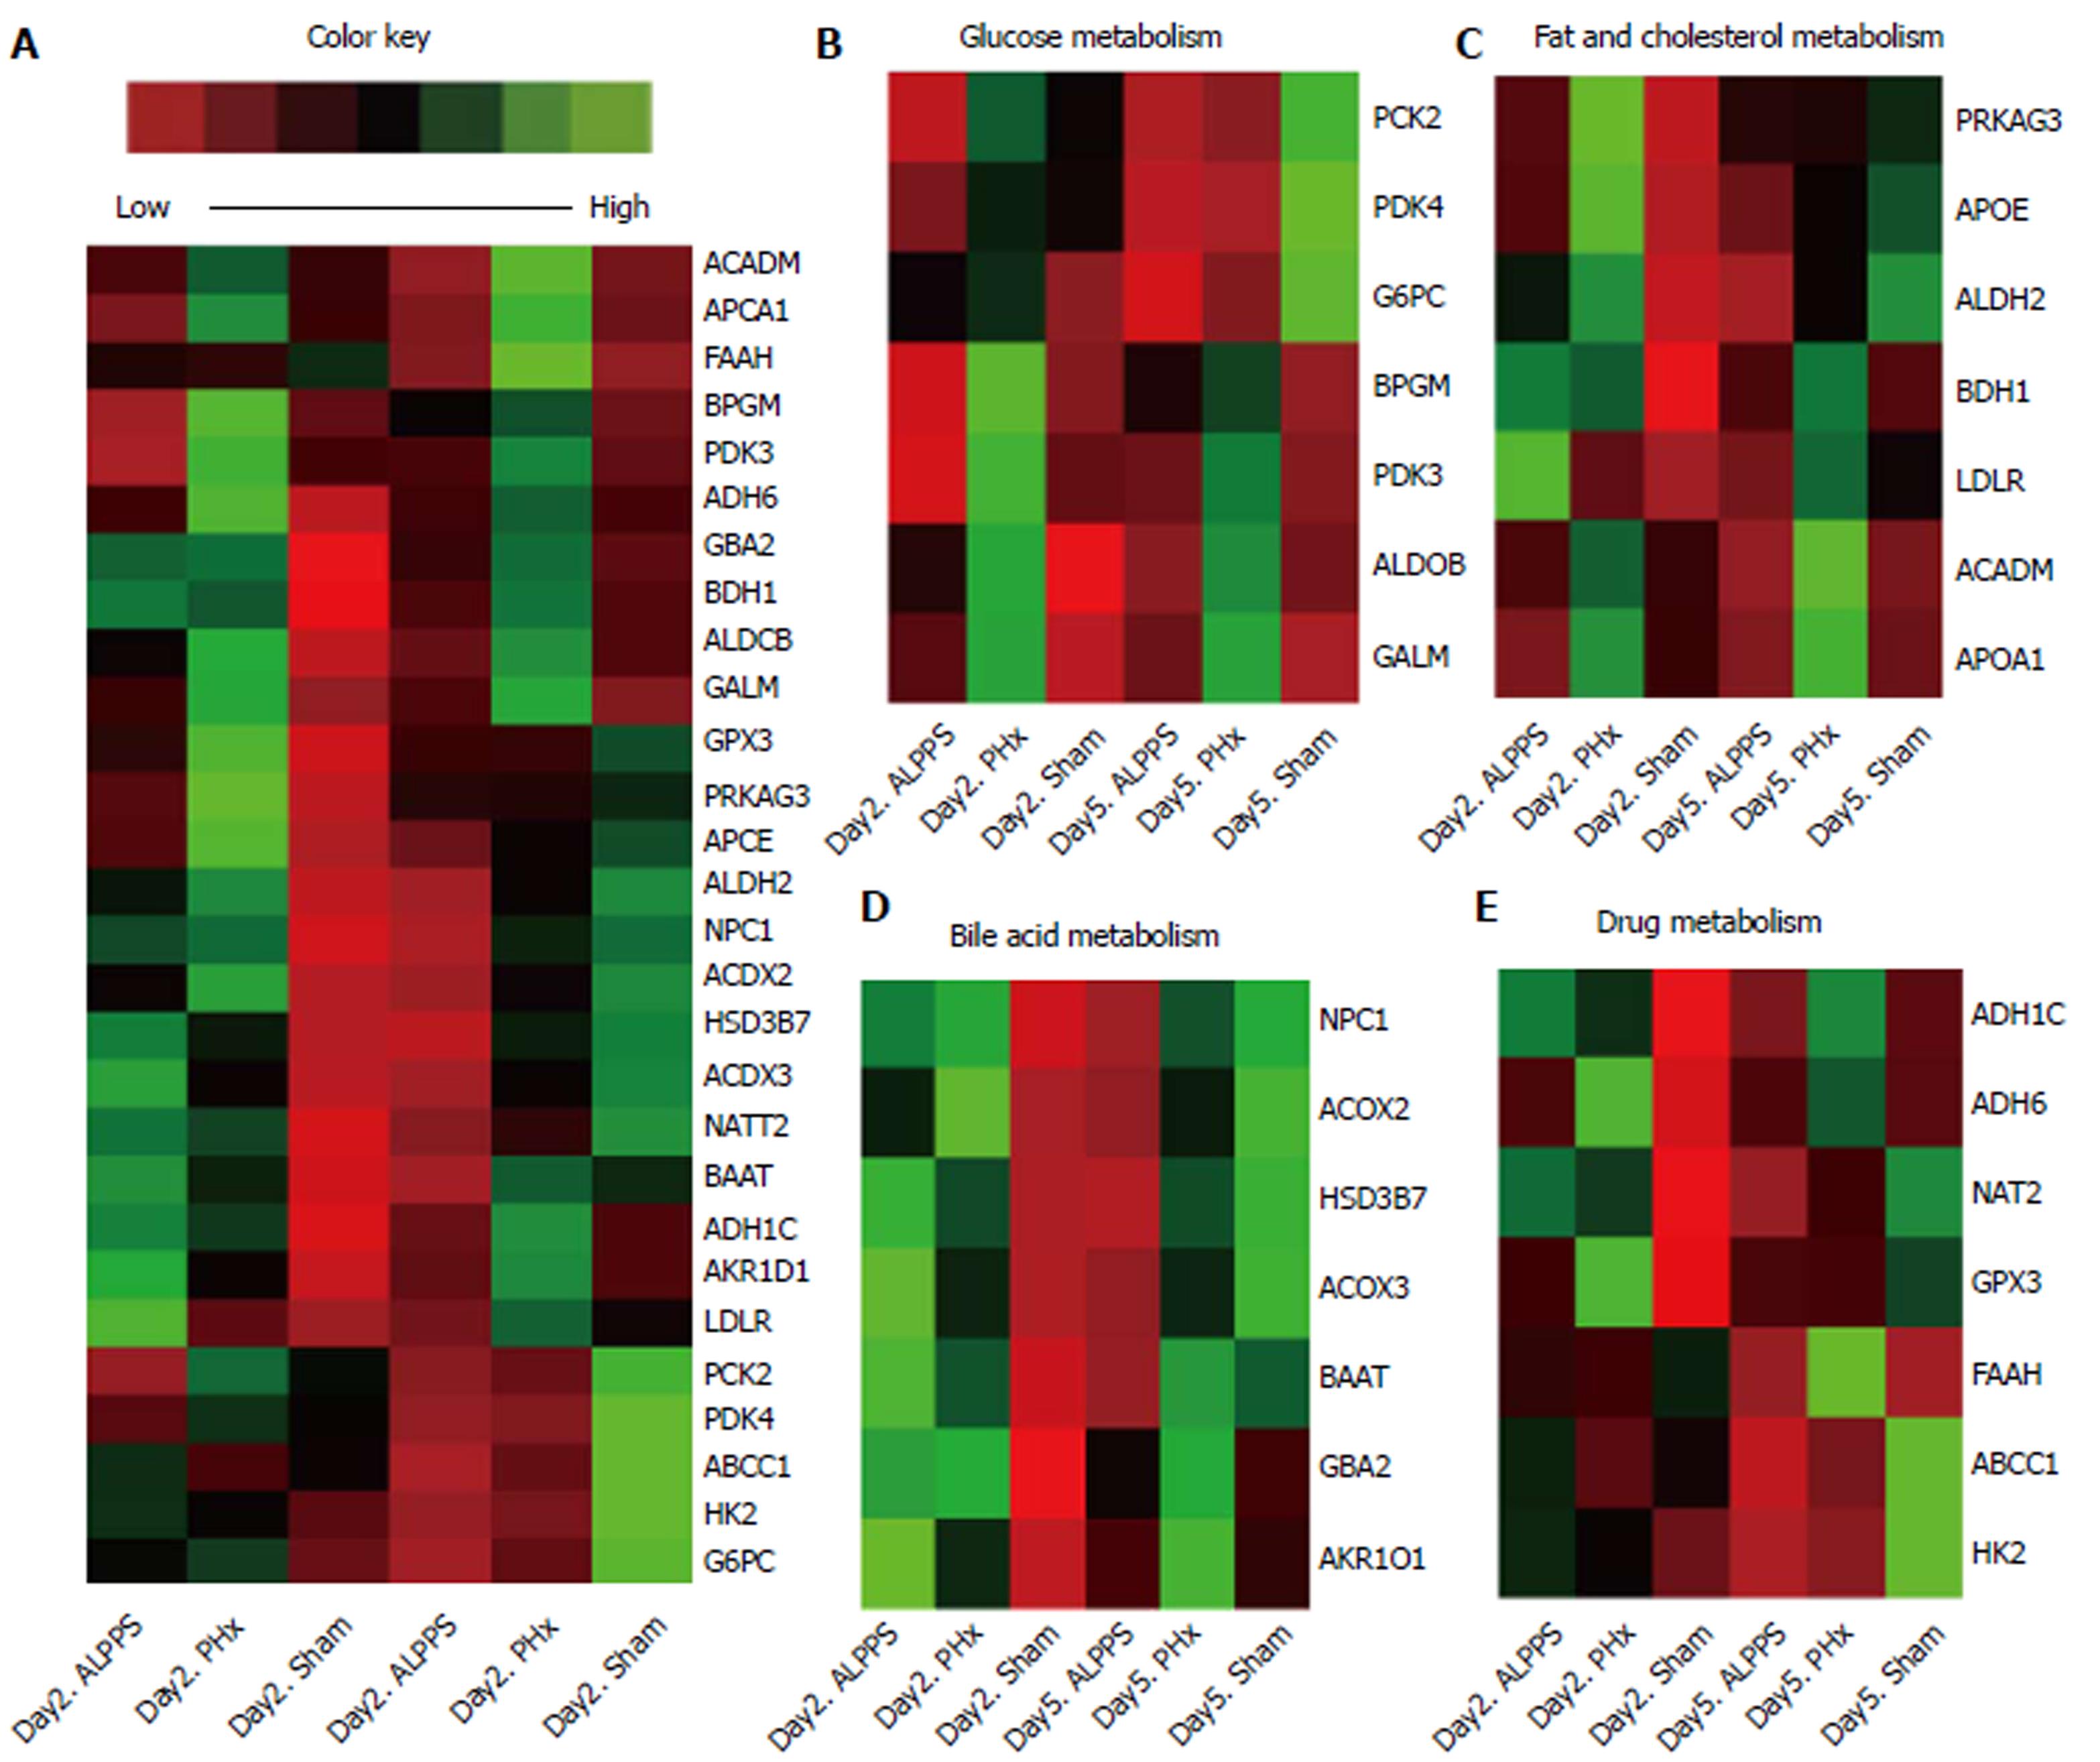
Figure 5 Cluster analysis of different expression of functional genes.
The color key represented the abundance expression of indicated genes (Compared with corresponding sham group at each time point). A: The overall cluster analysis of expression of functional genes; B: Glucose metabolism associated functional genes; C: Fat and cholesterol metabolism associated functional genes; D: Bile acid metabolism associated functional genes; E: Drug metabolism associated functional genes.
- Citation: Tong YF, Meng N, Chen MQ, Ying HN, Xu M, Lu B, Hong JJ, Wang YF, Cai XJ. Maturity of associating liver partition and portal vein ligation for staged hepatectomy-derived liver regeneration in a rat model. World J Gastroenterol 2018; 24(10): 1107-1119
- URL: https://www.wjgnet.com/1007-9327/full/v24/i10/1107.htm
- DOI: https://dx.doi.org/10.3748/wjg.v24.i10.1107


