Copyright
©The Author(s) 2018.
World J Gastroenterol. Mar 14, 2018; 24(10): 1072-1083
Published online Mar 14, 2018. doi: 10.3748/wjg.v24.i10.1072
Published online Mar 14, 2018. doi: 10.3748/wjg.v24.i10.1072
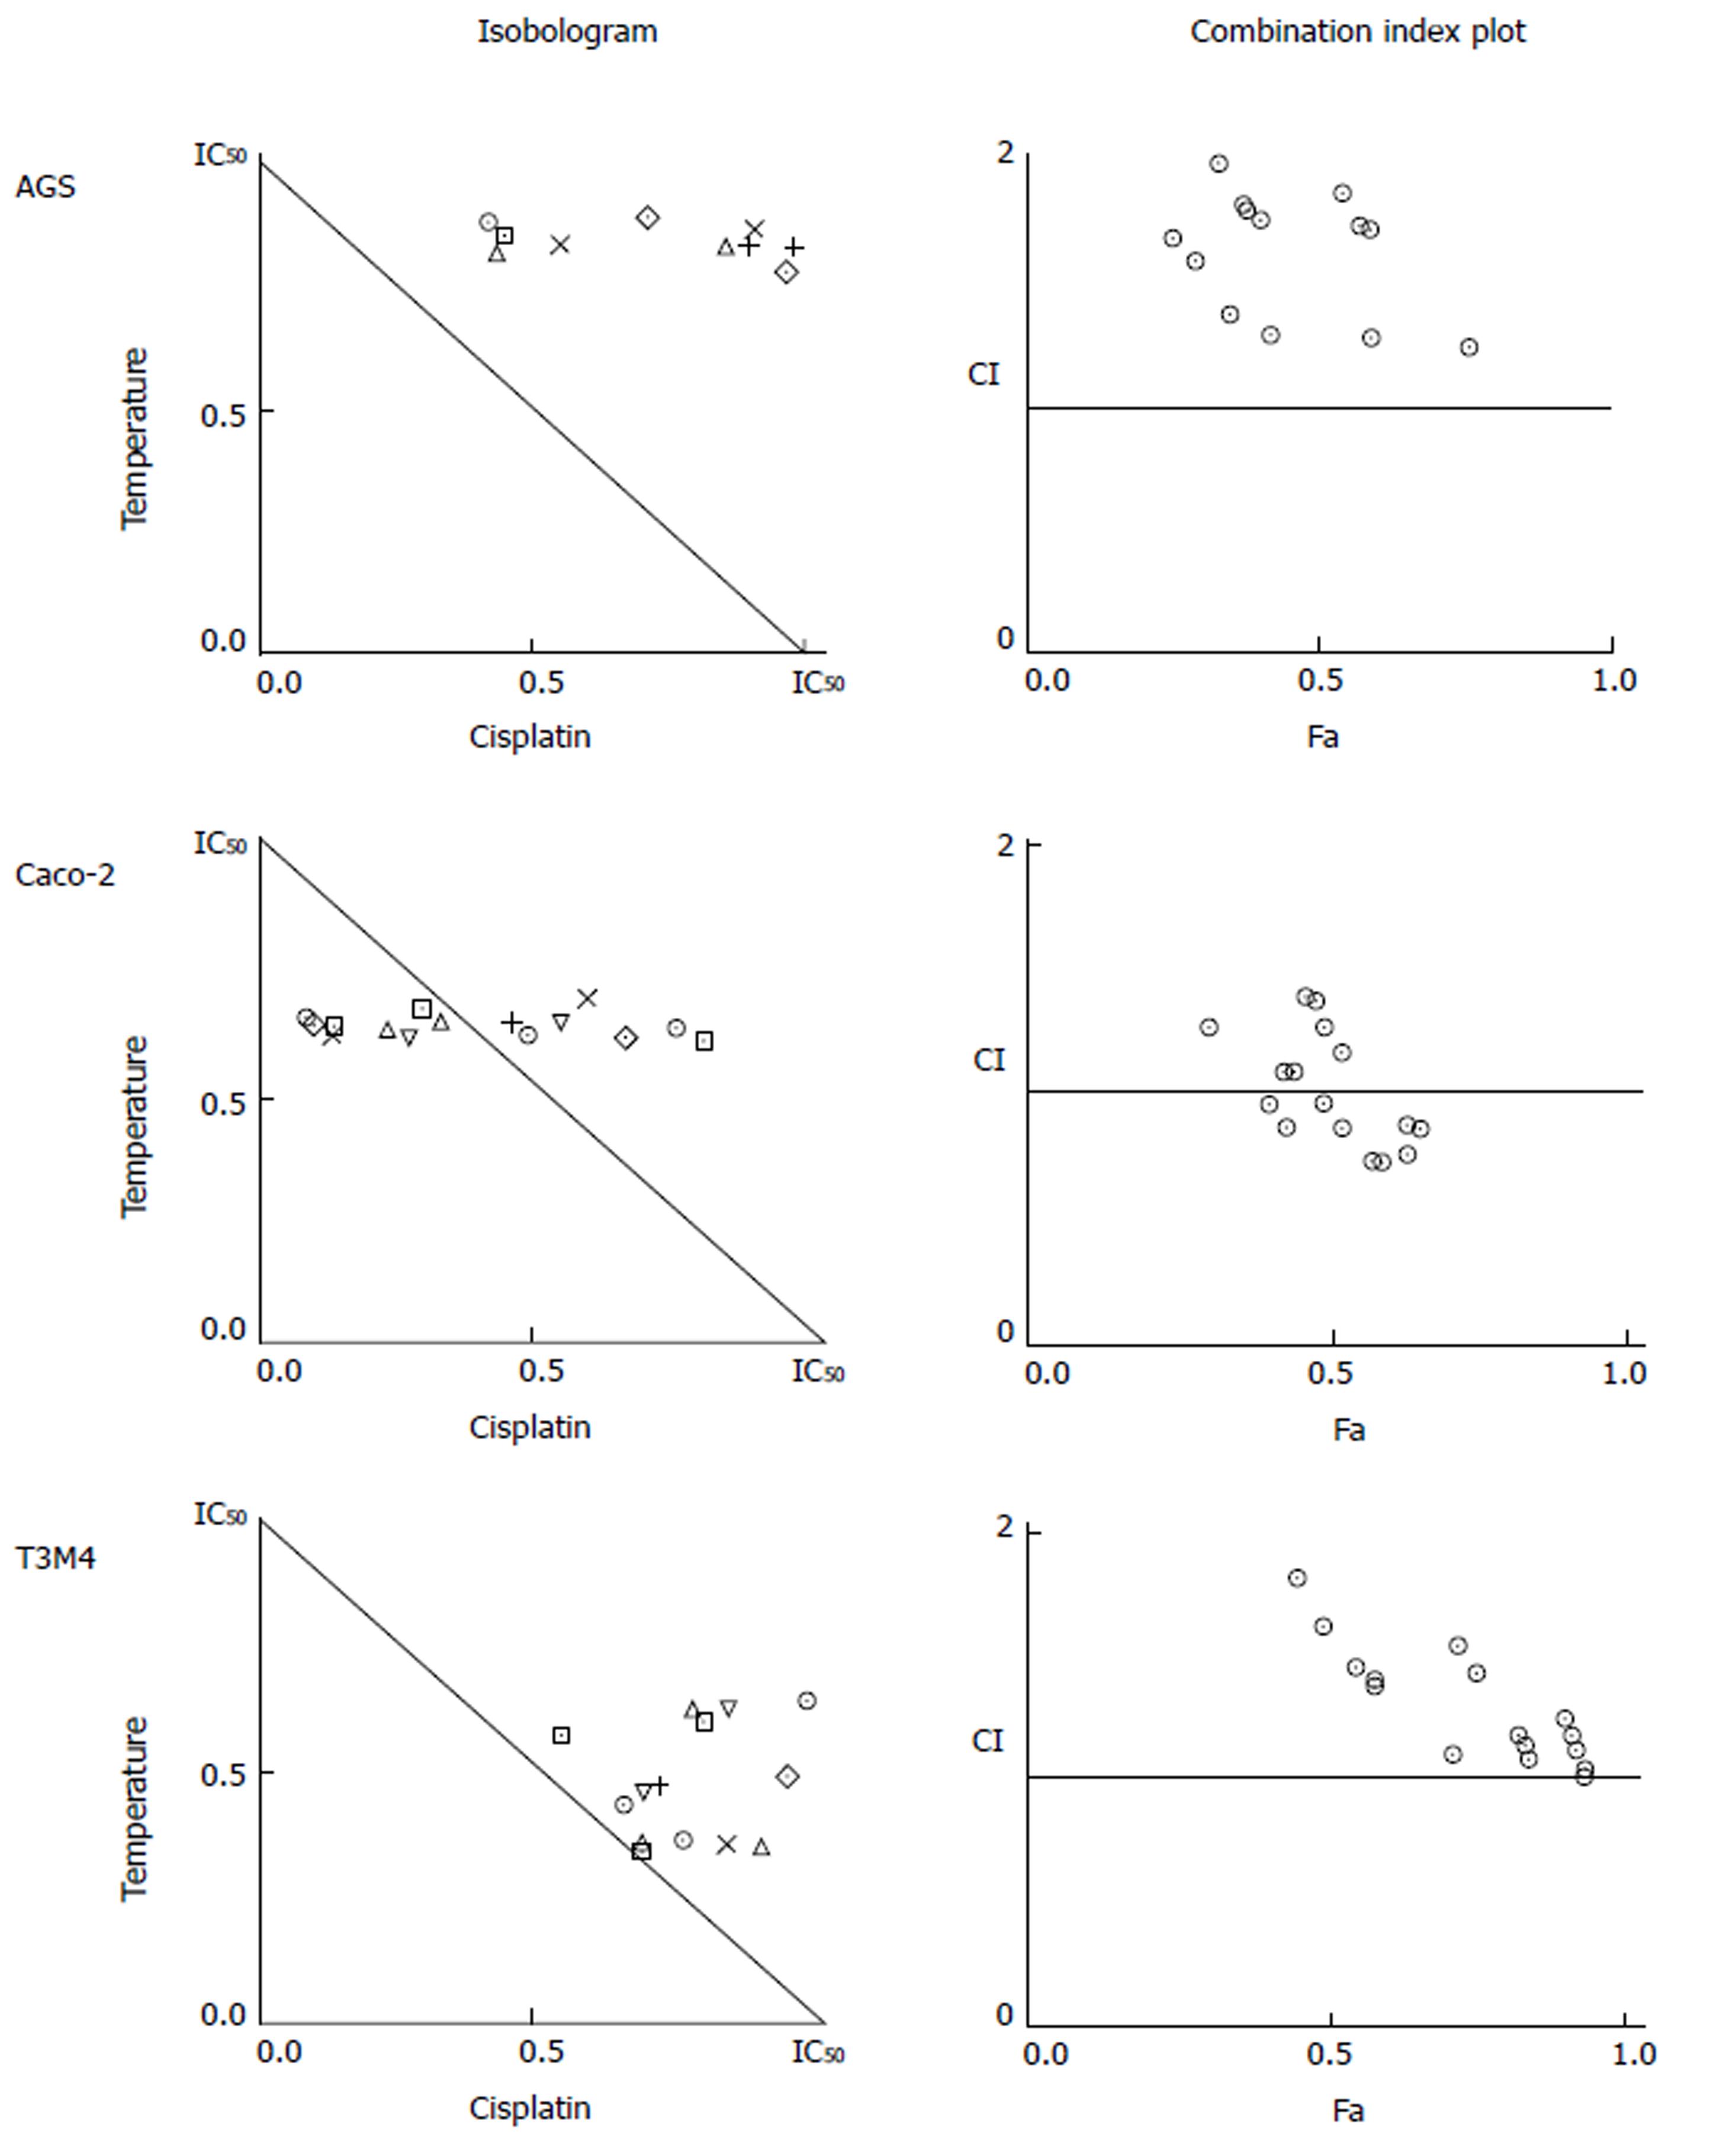
Figure 5 Interaction of temperature and cisplatin using the isobologram method for cancer cell viability.
Mathematically revealed combined effects of hyperthermia and cisplatin differ in AGS, Caco-2, and T3M4 cell lines. The isobologram represents the interaction between cisplatin and temperature resulting in inhibition of cancer cell growth. The solid line in the diagram (Combination Index = 1) indicates the alignment of theoretical values of an additive interaction between two effectors and represents calculated conditions required to inhibit cell growth by 50%. Mathematically calculated IC50 for AGS cells: temperature 51 °C, cisplatin 159 μmol/L; Caco-2 cells: temperature 66 °C, cisplatin 328 μmol/L; T3M4 cells: temperature 61 °C, cisplatin 0 μmol/L. Treatment combination points falling above the line indicate mathematical antagonism (below synergism, on the line additivity). Combination points that are distant from the line are not shown. Tables on the right represent the CI of selected combinations.
- Citation: Cesna V, Sukovas A, Jasukaitiene A, Naginiene R, Barauskas G, Dambrauskas Z, Paskauskas S, Gulbinas A. Narrow line between benefit and harm: Additivity of hyperthermia to cisplatin cytotoxicity in different gastrointestinal cancer cells. World J Gastroenterol 2018; 24(10): 1072-1083
- URL: https://www.wjgnet.com/1007-9327/full/v24/i10/1072.htm
- DOI: https://dx.doi.org/10.3748/wjg.v24.i10.1072


