Copyright
©The Author(s) 2018.
World J Gastroenterol. Jan 7, 2018; 24(1): 46-57
Published online Jan 7, 2018. doi: 10.3748/wjg.v24.i1.46
Published online Jan 7, 2018. doi: 10.3748/wjg.v24.i1.46
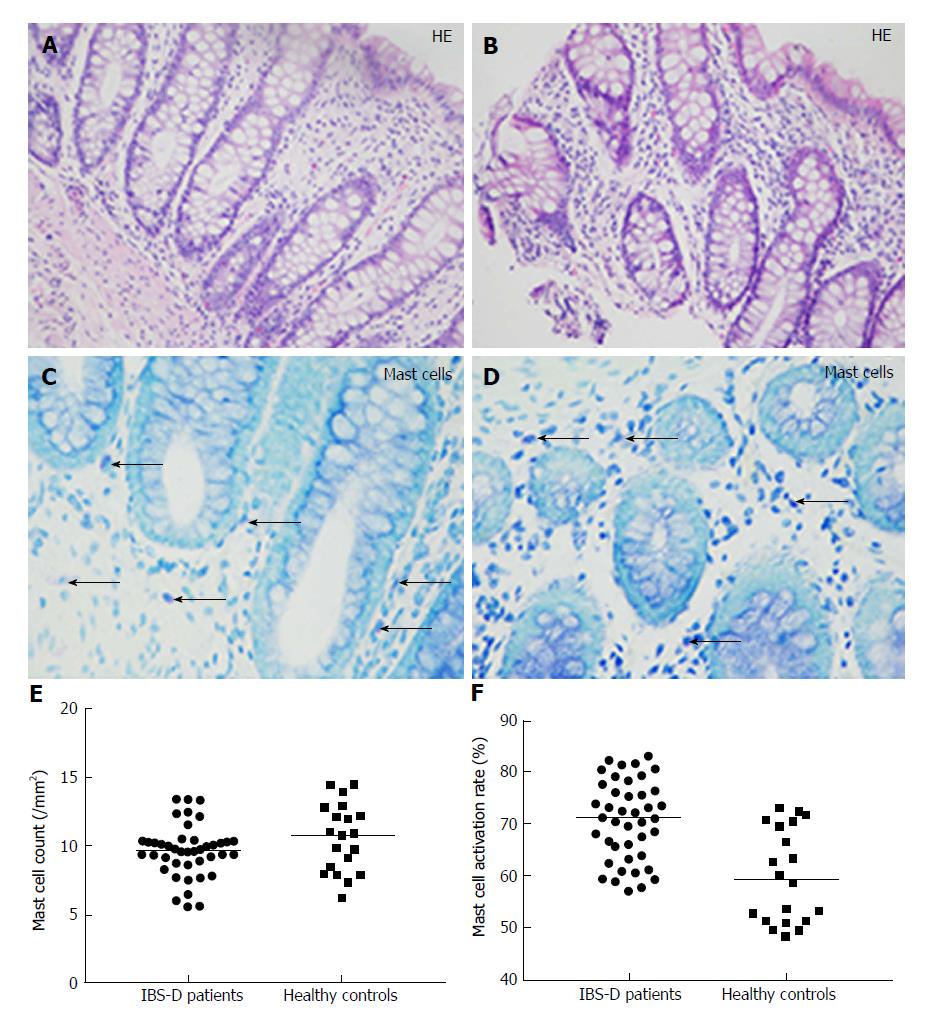
Figure 1 Intestinal mucosal histology (hematoxylin and eosin staining), mast cell toluidine blue staining, mast cell count (/mm2), and mast cell activation rate (%) in irritable bowel syndrome patients and controls.
A: Colonic mucosal histology of IBS-D patients (× 200); B: Colonic mucosal histology of healthy controls (× 200); C: Mast cell toluidine blue staining of IBS-D tissue (× 400, arrows represent mast cells); D: Mast cell toluidine blue staining of normal control tissue (× 400, arrows represent mast cells); E: Mast cell count was not significantly different between the two groups (P = 0.164); F: Mast cell activation rate significantly increased in IBS-D patients (P < 0.001). Line in the scatter plots means the median. IBS-D: Iirritable bowel syndrome with diarrhea.
- Citation: Liu DR, Xu XJ, Yao SK. Increased intestinal mucosal leptin levels in patients with diarrhea-predominant irritable bowel syndrome. World J Gastroenterol 2018; 24(1): 46-57
- URL: https://www.wjgnet.com/1007-9327/full/v24/i1/46.htm
- DOI: https://dx.doi.org/10.3748/wjg.v24.i1.46


