Copyright
©The Author(s) 2018.
World J Gastroenterol. Jan 7, 2018; 24(1): 23-34
Published online Jan 7, 2018. doi: 10.3748/wjg.v24.i1.23
Published online Jan 7, 2018. doi: 10.3748/wjg.v24.i1.23
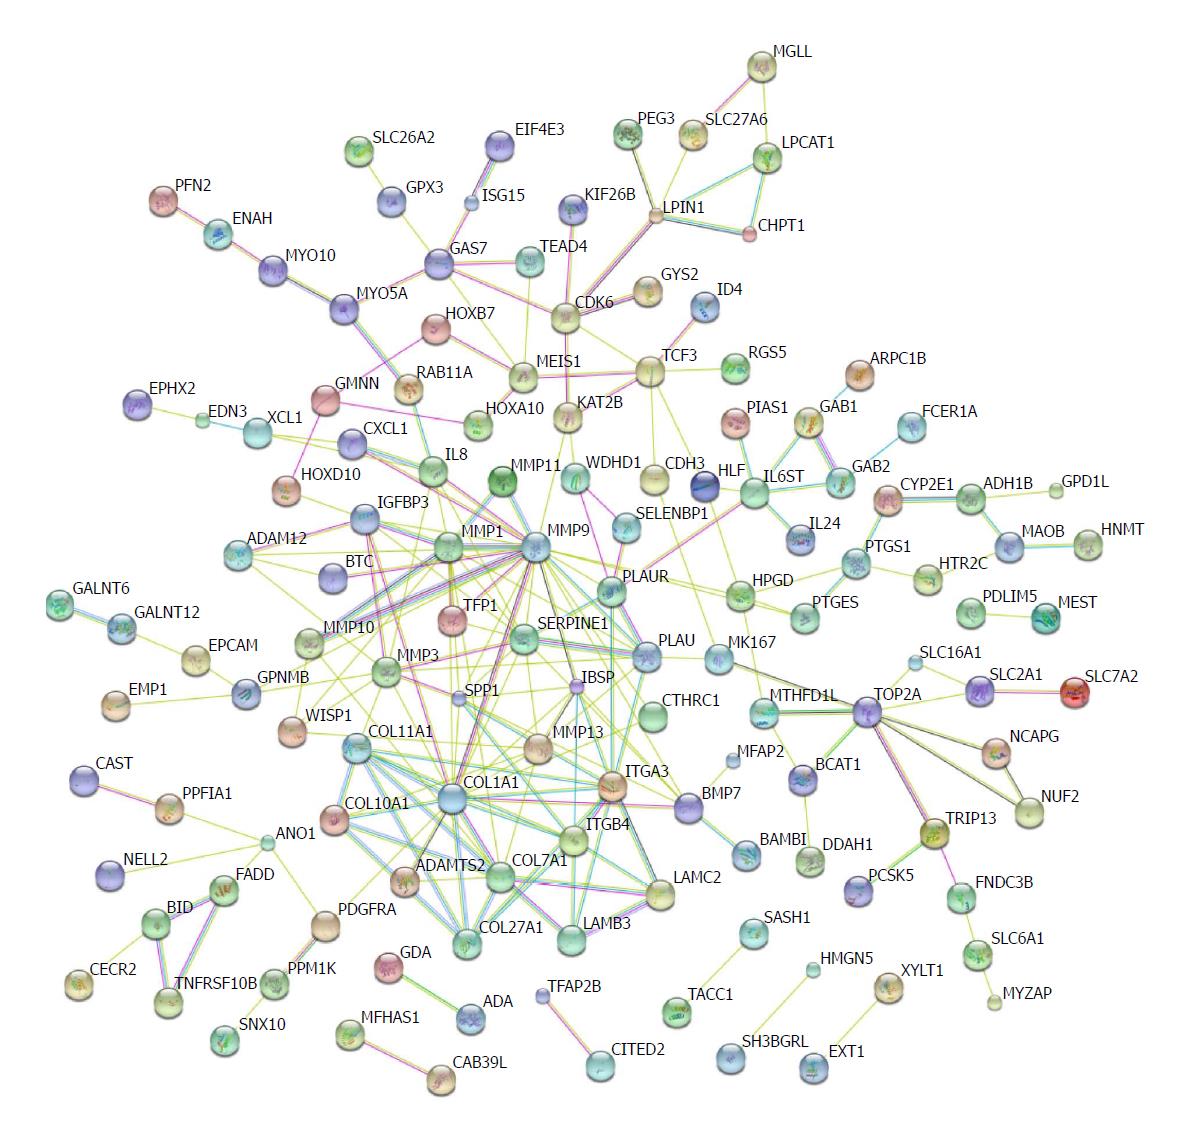
Figure 5 Protein regulation network analysis.
The protein-protein interaction networks were constructed by Cytoscape Software. Proteins are represented with colour nodes, and interactions are represented with edges.
- Citation: Xue WH, Fan ZR, Li LF, Lu JL, Ma BJ, Kan QC, Zhao J. Construction of an oesophageal cancer-specific ceRNA network based on miRNA, lncRNA, and mRNA expression data. World J Gastroenterol 2018; 24(1): 23-34
- URL: https://www.wjgnet.com/1007-9327/full/v24/i1/23.htm
- DOI: https://dx.doi.org/10.3748/wjg.v24.i1.23


