Copyright
©The Author(s) 2018.
World J Gastroenterol. Jan 7, 2018; 24(1): 23-34
Published online Jan 7, 2018. doi: 10.3748/wjg.v24.i1.23
Published online Jan 7, 2018. doi: 10.3748/wjg.v24.i1.23
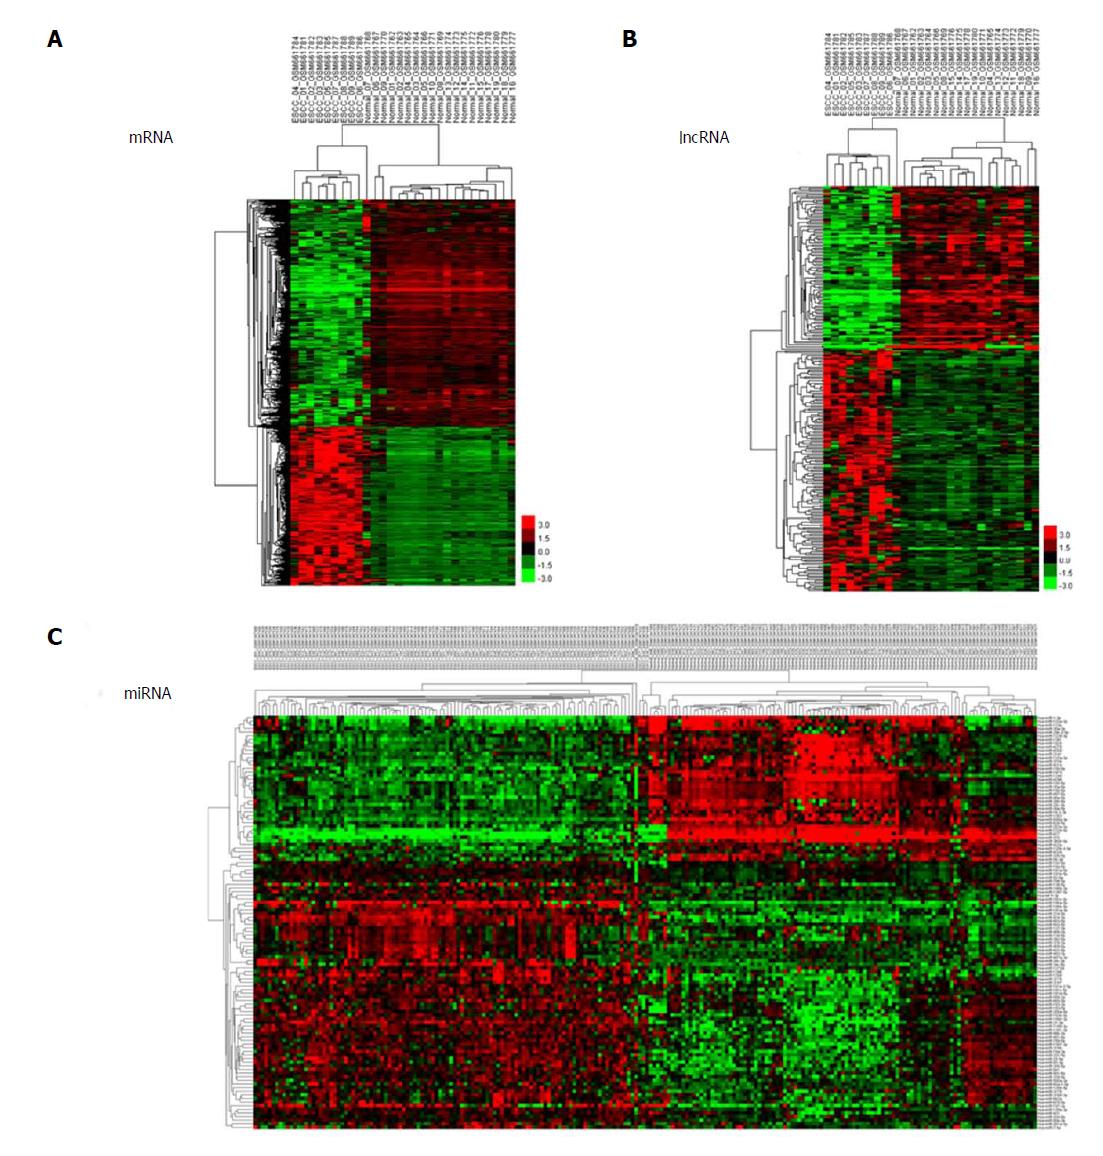
Figure 1 Cluster analysis of differentially expressed profiles.
A: mRNAs; B: lncRNAs; and C: miRNAs in tumour tissues vs adjacent non-tumour tissues. The result of hierarchical cluster analysis shows distinguishable expression profiles between samples. The rows show differentially expressed miRNAs, lncRNAs, and mRNAs, while the columns show three paired samples. Red represents high expression and green represents low expression.
- Citation: Xue WH, Fan ZR, Li LF, Lu JL, Ma BJ, Kan QC, Zhao J. Construction of an oesophageal cancer-specific ceRNA network based on miRNA, lncRNA, and mRNA expression data. World J Gastroenterol 2018; 24(1): 23-34
- URL: https://www.wjgnet.com/1007-9327/full/v24/i1/23.htm
- DOI: https://dx.doi.org/10.3748/wjg.v24.i1.23


