Copyright
©The Author(s) 2017.
World J Gastroenterol. Mar 7, 2017; 23(9): 1725-1734
Published online Mar 7, 2017. doi: 10.3748/wjg.v23.i9.1725
Published online Mar 7, 2017. doi: 10.3748/wjg.v23.i9.1725
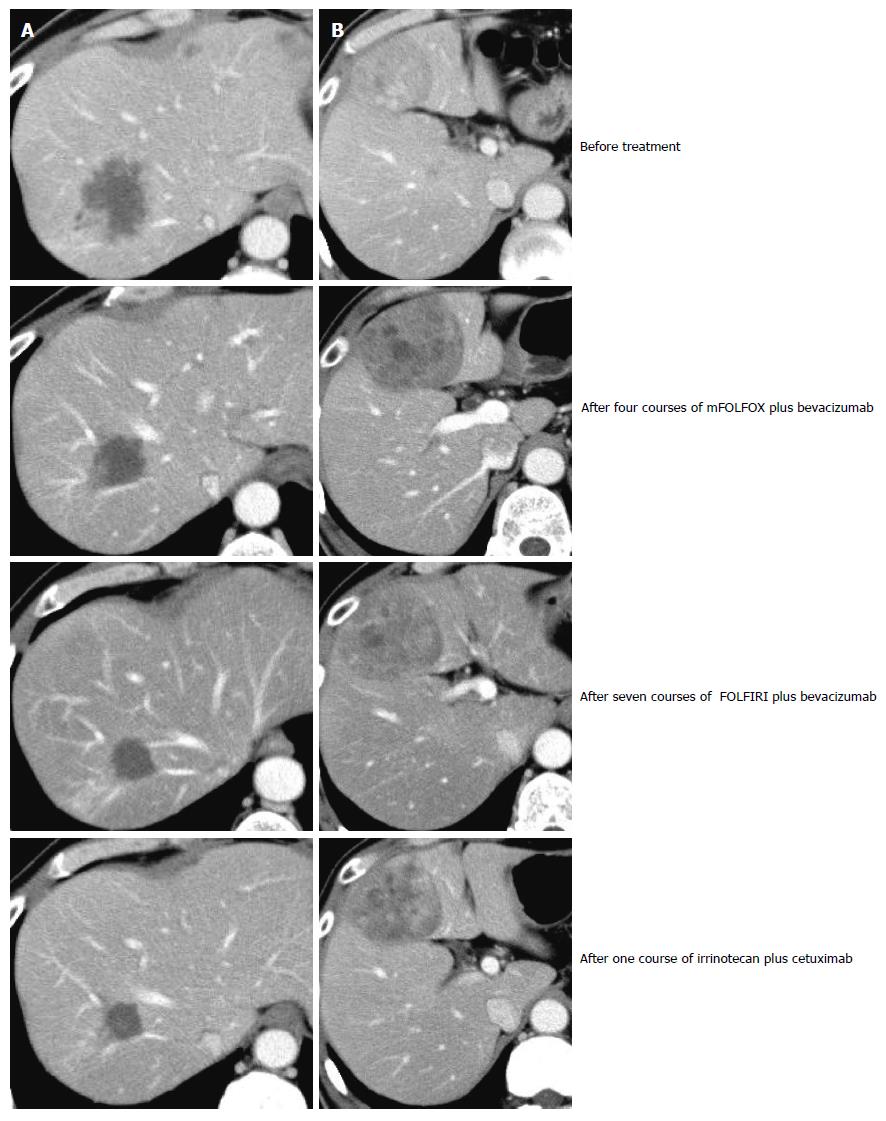
Figure 3 Changes in computed tomography images during treatment.
The tumors in Segments 3 and 8 showed a gradual decrease in size, while the tumor in Segment 4 exhibited a one-time increase and then a decrease in size. A: S8 gradually decreased in size/S3 disappeared; B: S4 once increased then decreased in size.
- Citation: Aoki H, Arata T, Utsumi M, Mushiake Y, Kunitomo T, Yasuhara I, Taniguchi F, Katsuda K, Tanakaya K, Takeuchi H, Yamasaki R. Synchronous coexistence of liver metastases from cecal leiomyosarcoma and rectal adenocarcinoma: A case report. World J Gastroenterol 2017; 23(9): 1725-1734
- URL: https://www.wjgnet.com/1007-9327/full/v23/i9/1725.htm
- DOI: https://dx.doi.org/10.3748/wjg.v23.i9.1725


