Copyright
©The Author(s) 2017.
World J Gastroenterol. Mar 7, 2017; 23(9): 1602-1607
Published online Mar 7, 2017. doi: 10.3748/wjg.v23.i9.1602
Published online Mar 7, 2017. doi: 10.3748/wjg.v23.i9.1602
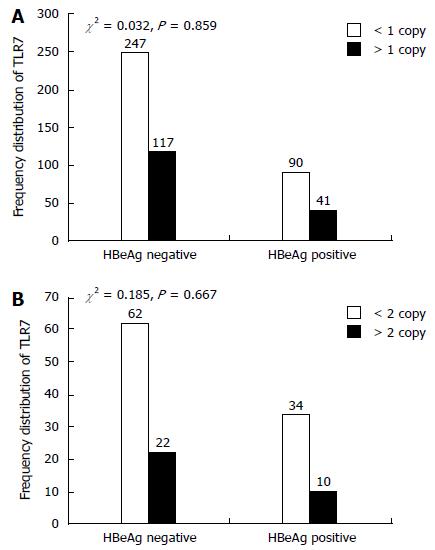
Figure 2 Frequency distribution of TLR7 gene copy numbers in males and females according to e-antigen titer.
Patients were divided into two groups according to the titer of e antigen: HBeAg negative (0-1 IU/mL) and HBeAg positive (> 1 IU/mL). A: Male patients; B: Female patients.
- Citation: Li F, Li X, Zou GZ, Gao YF, Ye J. Association between TLR7 copy number variations and hepatitis B virus infection outcome in Chinese. World J Gastroenterol 2017; 23(9): 1602-1607
- URL: https://www.wjgnet.com/1007-9327/full/v23/i9/1602.htm
- DOI: https://dx.doi.org/10.3748/wjg.v23.i9.1602


